Chapter 12.5 Match grazing pressure to feed supply
Chapter 12.5 Match grazing pressure to feed supply
Background information
Estimating feed supply is an important part of determining stocking rate in a paddock or for a particular land system.
The amount of feed available will depend on a range of factors, including:
- Land units and the land system
- Seasonal conditions
- Land condition, how well the land is managed and how responsive the system is to rainfall
- Different plant communities
- Diversity of species.
Animal production depends on quantity and quality of forage available. During periods of active growth, green grasses and forbs that have a high digestibility provide energy and protein to sustain higher levels of animal production. As these plants mature and become more fibrous, digestibility decreases and the amount of metabolisable energy and protein decreases, resulting in lower levels of production. Therefore the amount of forage required to meet requirements increases as quality decreases. Poor quality feed may not be adequate to maintain some classes of sheep.
At a glance
- Identify your feed supply throughout the year.
- Calculate your total grazing pressure for key times of the year.
- Consider the impact of non-domesticated species on your total grazing pressure.
- Are there any opportunities to alter your program to better align supply and demand?
This chapter outlines processes and issues that relate to measuring available feed for your animals, feed quality issues, seasonal considerations and how to use this information to manage supply and demand. These include:
- Know your seasonal feed supply.
- Calculate total grazing pressure.
- Match production cycle to feed quality and quantity.
- Manage grazing pressure and monitor feed supply.
Know your feed supply
Feed availability
The amount of forage available determines what stocking rates you are able to run and for how long this feed will last. Seasonal conditions will govern what regrowth occurs, and this also impacts on the stocking rate and grazing period. In order to make basic decisions regarding your grazing operation, it is essential that you have a solid understanding of how long current forage will last.
Estimates are made by calculating the amount of dry matter per hectare. This can be done by measuring forage directly or using photo standards. Photo standards are available for all pastoral areas (see signposts for some options).
Factors to consider when estimating feed quantity
Estimating the available feed of a property is no easy task due to scale and the variability in land and vegetation types. However with practice and regular checking of your estimates, accuracy will improve quite quickly.
- When estimating the amount of feed available, bear in mind the following factors:
- Do not include feed you know the stock will not eat (non-palatable plants).
- Aim to leave 70% of the available feed to ensure the plants can grow again, rather than letting animals graze all of the plant/pasture.
- Determine a realistic grazing radius from each water point to calculate the area grazed. Look for obvious signs of grazing and sheep activity at a number of points away from water and work out the furthest point sheep range. However, it important not to include areas that are outside a realistic grazing distance from water. The distance sheep range will also depend on the livestock’s water requirements. For example, lactating ewes won’t graze as far out from water as dry stock and high temperatures can limit the grazing radius.
- Consider how long the pasture will last. For example, is it made up of perennial grasses rather than annual forbs that will shrivel up and blow away on the first hot day.
Be mindful when making your calculations that the total dry matter present in a paddock is not all made available to your sheep. In the pastoral areas, a conservative utilisation rate of dry matter is adopted to ensure that there is sufficient biomass remaining after grazing. This is often set at 20 to 30% (see Match grazing pressure to feed supply later in this chapter for more information about utilisation rate). This residual biomass is useful for ensuring adequate groundcover remains to:
- Protect soils from wind and water erosion.
- Allow water to infiltrate when rain falls which facilitates rapid pasture growth in response to rainfall received.
- Ensure efficient nutrient cycling (good soil cover means more soil water and nutrients available for pasture growth.
SIGNPOSTS
WATCH
Using forage shrubs to boost the productivity, profitability and sustainability of Australia’s pastures, to reduce risk in low to medium rainfall zone grazing systems.
READ
USE
A essential tool in good grazing land management. They will help you develop pasture budgets and dry season business management plans. There are photo standards and corresponding pasture yields for many of Queensland’s common pasture communities (based on region or pasture species).
The FOO Library allows users to estimate FOO and nutritive value of grazed pastures.
Calculate total grazing pressure
Once you know the standing dry matter, or available dry matter, you can then utilise the standard intake requirements that are well known for sheep.
The total demand for forage by both domestic and non-domestic animals relative to forage supply is known as total grazing pressure (TGP).
TGP is determined by calculating the total grazing pressure exerted by domestic and other grazing animals (tool 12.13). This provides the most realistic indicator of the number of grazing animals and the grazing pressure being exerted on a paddock. The grazing pressure is specified using the standard measure of a dry sheep equivalent (DSE) (tool 12.14).
The grazing pressure from domestic livestock can at times be equaled or exceeded by grazing pressure from other animals, including:
- Native species (e.g., kangaroos, euros, wallabies);
- Wild goat herds;
- Large feral animals (e.g., camels, horses, donkeys, pigs); and
- Small feral animals (e.g., rabbits).
The grazing pressure from these animals can be significant and needs to be included when assessing the total grazing pressure of stock in the paddock. Determining a realistic estimate for the non-domestic animals can be difficult as some of the species listed are quite transient and move within and between properties, depending on levels of feed, water and disturbance.
Approaches to determining pressure from non-domestics are described in this chapter. Grazing management is difficult when there is a proportion of the grazing pressure that is unmanaged, as producers often have limited control over non-domestic herbivores. Hence, it can be an important step in grazing management for you to quantify and make an assessment of the issue on your property.
Grazing pressure can be determined by conducting:
- A ‘step – point transect’ process to assess the levels of dung for different grazing species;
- A spotlight survey at night for kangaroos, goats and rabbits; or
- An aerial survey for kangaroos.
Dry sheep equivalents
The dry sheep equivalent (DSE) is a standard unit used to compare the feed requirements of different classes of stock.
One DSE is based on the energy required by a 50 kg wether (i.e. a dry sheep) to maintain condition score 3 and body weight.
Animals that have a higher feed requirement than 1 DSE (e.g., a lactating ewe or one weighing more than 50 kg) will have a higher DSE rating.
To estimate a DSE figure for stock, an estimate of standard reference weight (SRW) and the class of stock is required. SRW refers to the weight of a ewe that is not pregnant, in condition score 3, bare shorn (if not a shedding breed), with no gutfill. Tool 10.7 in MMFS Module 10 Wean More Lambs will assist you in performing the SRW calculation for your flock. Standard DSE tables assist in determining the relevant DSE value for each class of grazing stock.
Total grazing pressure is determined by attributing a dry sheep equivalent (DSE) rating to the different species grazing in a paddock. The glove box guide to tactical grazing management uses the ratings for different species as follows:
- 50 kg wether = 1 DSE
- 500 kg dry cow = 8 DSE
- Goat = 1 DSE
- Kangaroo = 0.75 DSE
- Rabbit = 0.1 DSE
Further details of DSE ratings for different classes of domestic and non-domestic animals are provided in tool 12.14.
Calculating DSEs for your property
Use the tables in tool 12.14 to calculate the DSE ratings for the different classes of livestock on your property. Bear in mind that your DSEs will vary according to class of animal throughout the year. A breeding ewe will have varying DSE rating over the year according to her reproductive status.
SIGNPOSTS
READ
USE
Determine the number of cattle or sheep you should put into a paddock based on its carrying capacity.
ATTEND
The course is delivered in small groups of 5-7 sheep producers that meet six times per year with a professional trainer. During these hands-on sessions, the group visits each participating farm and learns skills in condition scoring, pasture assessment and best practice ewe and lamb management to increase reproduction efficiency and wool production, mainly through reducing ewe and lamb mortality.
A one-day workshop that gives producers a broad understanding of the environment in which they operate and the core principles behind successfully maintaining grazing land condition and long-term productivity.
Designed for producers to develop a thorough understanding of the grazing land environment in which they operate to strategically manage their grazing business to optimise land condition and productivity in the long-term and begin developing grazing land management plans for their properties.
Match production cycle to feed quality and quantity
In order to meet productivity targets in your livestock enterprise, it is important to know when your feed supply and feed demand are at their highest, and identify any shortfalls that may exist or plan for times of shortfall.
Pastoral grazing businesses are often governed by other significant factors (for example, access to markets) as well as seasonal feed availability in determining when key livestock operations are carried out, and therefore supply and demand may not always match up perfectly.
Nevertheless, it is essential that you undertake a fodder budgeting activity to increase your awareness to key periods of peak demand and endeavour to align these with peak supply as often as possible.
Feed demand is calculated based on:
- The number of stock grazing (including non-domesticated animals);
- Their physiological state (dry, pregnant, lactating, weaned); and
- Production requirements (maintenance or finishing).
Production cycle
The annual production cycle, or ‘program’, is unique to individual properties and is usually based around seasonal conditions and feed supply, markets and accessibility to the property. These factors are innately considered as they are logical factors in determining the timing of key operations and events on the property.
Ideally programs align key finishing times, selling times or lambing times with highest levels of available feed. This ensures optimum productive outputs from the resources available at the time. An important part of this process is to understand the feed requirements at these key times of all classes of stock on your property.
By recording rainfall and stocking rate over time, you will build up a profile of how your property’s stocking rate is tracking according to rain received, which will enable you to make informed decisions regarding stocking rates and formulate strategies to manage tight periods. This activity may be of limited use in areas with aseasonal rainfall patterns (where there is no seasonality to rainfall patterns).
A mixture of species is indicative of a stable and productive grazing system and will give sheep access to a more balanced diet with a larger selection of species available.
There are a number of different factors that influence feed production from native pastures and include the following:
- Land systems type
- Seasonal conditions
- Rangeland condition
- Available grazing area
- Grazing preference
- Stocking rate.
All pasture and rangeland grazing plants follow a similar pattern of growth, which determines quality and quantity of herbage mass at a given time. Figure 12.1 illustrates the changes in feed quality and quantity from the beginning to the end of the growing season. Performance of grazing stock is impacted significantly by both quality and quantity of feed on offer.

Figure 12.1 Phases of pasture growth.
Source: MLA, adapted by AWI and MLA
Another way to consider the quality and quantity issue regarding feed availability is to consider their relative stability and quality. An exception to the quality and quantity table above is where shrubs and browse species are concerned. Despite being lower in overall quality, generally their quality and quantity is less variable over time. These species are of high value because of their stability in the grazing environment. Ephemerals and browse are at opposite ends of the spectrum. In variable arid and semi arid environment both attributes are desirable. Perennials and annuals are not inferior or superior to one another, but have complementary qualities.
In a pastoral grazing system, grazing animals will generally preferentially select pasture components in the following order (depicted in figure 12.2):
- Forbs (herbs)
- Green annual grasses
- Green perennial grasses
- Dry herbage
- Copperburrs (Sceroleana spp.) and annual saltbushes (Atriplex spp.)
- Bluebushes (Maireana spp.), saltbushes (Atriplex spp.) and tree browse

Figure 12.2 Continuum from ephemeral to browse species.
Source: Harrington et al. 1984, adapted by AWI & MLA
The information presented on quality and dietary preferences is general and site-specific information should be sought on quality and characteristics of specific species in your pasture. The composition of livestock diets will change considerably between paddocks and seasons.
Energy
Energy is the main limiting factor to animal performance and survival. The amount of energy contained in feed varies throughout its life cycle, and can support different levels of animal production.
The amount of energy derived from a feed is related to the digestibility of the feed. Digestibility is the percentage of the feed that is converted to energy when consumed. The higher the digestibility, the higher the energy in the feed. The lower the digestibility, the lower the amount of energy in a feed, and more is passed through the animal and removed as waste product.
In using this analogy, prioritise animal requirements starting with energy. Energy in feed is expressed as megajoules of metabolisable energy per kilogram of dry matter (MJ ME/kg DM). When addressing nutritional requirements, energy requirements should be addressed first. If pastures are deficient in digestible energy this will be the most limiting nutrient.
Lower than ideal levels of energy will lead to performance issues for sheep flocks:
- Low conception rates due to rams being below optimal condition score (CS) 3.5 at joining
- Low conception rates due to ewes being below optimal CS 3.0 at joining
- Condition scores will fall rapidly for pregnant ewes, leading to:
- Lower than ideal birth weights for lambs and increased losses
- Increased ewe mortality due to pregnancy toxaemia
- Poor growth and increased mortality of weaners and replacement stock
- Not meeting key marketing opportunities due to not being finished, or sale ready.
Quite often, what is growing between the shrubs and trees is providing the required energy for grazing stock.
As a rule of thumb, a 50 kg wether at CS 3 (1 DSE) will need to eat approximately 1 kg of dry matter per day with an energy level of 8 MJ ME/kg DM and a protein level of 8% for maintenance.
Tool 11.1 from MMFS Module 11 Healthy and Contented Sheep provides a summary of the requirements for other classes of livestock.
To calculate the feed requirements of livestock grazing, the digestibility, metabolisable energy and protein content of the feed needs to be determined, as this will impact the amount of feed that can be eaten and utilised by livestock. This information can be obtained by sending feed to a feed testing service to undertake a test to calculate the levels of dry matter, energy, protein, digestibility and minerals. You can also consult your local advisor who may be able to provide you local data on feed quality. This local knowledge will be a useful guide in the absence of actual feed test results. It should also be noted that stock will selectively graze certain parts of the plants (for example, leaves as opposed to stem) and therefore may be able to consume higher levels of energy or protein than an ‘average’ feed test result indicates is present.
You can also learn to estimate digestibility by observing pasture characteristics such as:
- availability of green material;
- whether the plants are in a reproductive phase; and
- the colour of dead material.
Figure 12.3 illustrates the relationship between feed quality (digestibility and energy) and the capacity of pasture to sustain various production levels in grazing stock as the plants mature. It shows that as a plant matures, the digestibility and metabolisable energy decrease.

Figure 12.3 The expected digestibility and metabolisable energy of tropical and temperate pasture declines as the pasture matures.
Source: South East Local Land Services, adapted from Prograze, NSWDPI, adapted by AWI and MLA
Protein
Protein is an essential component of the diet of sheep. Just like energy, the level of protein in different species will also vary through the growing season. Many of the pastoral grazing species have high levels of protein.
As is the case for energy, the level of protein in grazed plants will vary due to growth stage, rainfall, season and the area in which they are growing. Green plants generally contain sufficient protein for the maintenance of ruminants. When pastures dry out, protein decreases to sub-optimal levels for maintenance of sheep.
Animals selecting leaf over stem will also achieve higher performance than a ‘whole plant’ feed test will indicate. When interpreting feed test results, you need to consider the growth stage, and plant growth habit in context with what part of the plants the animals are utilising.
Figures 12.4a, 12.4b, 12.4c and 12.4d show examples of Feed on Offer Library entries for Mitchell grass and buffel grass. The Feed on Offer Library includes images of the sample in situ before it was cut and the resulting feed testing analysis from that cut. Further analysis is undertaken to estimate the amount of that feed a sheep could eat per day.
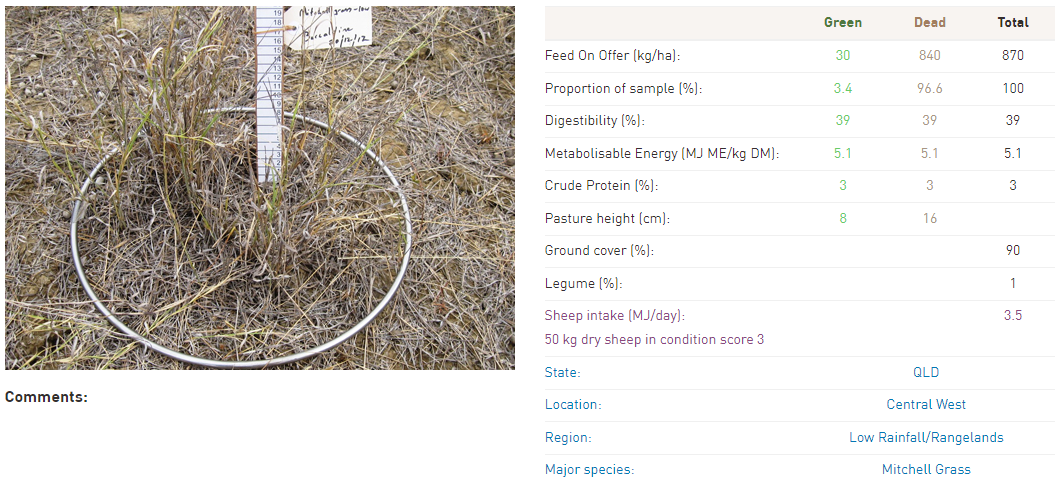
Figure 12.4a Feed on Offer Library entry for Mitchell grass sample of 870 kg/ha.
Source: AWI Feed on Offer Library
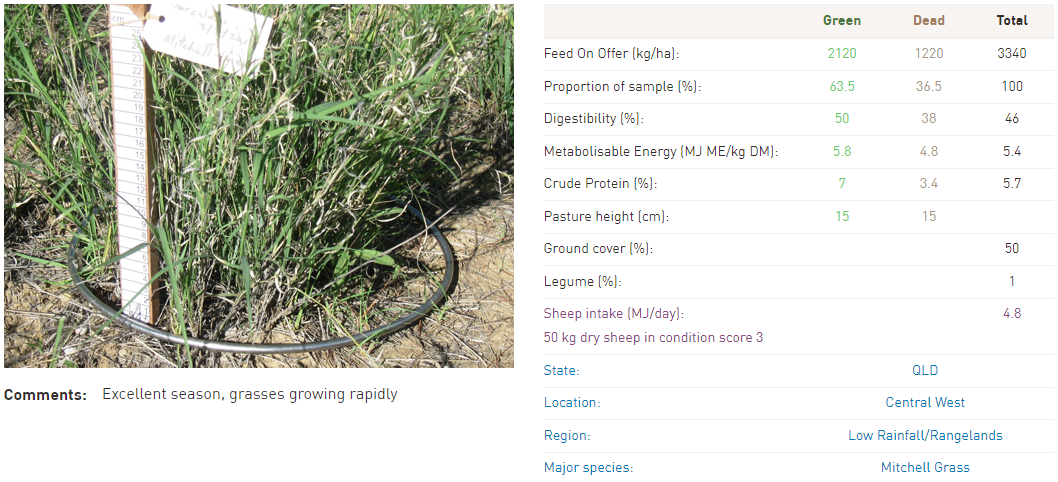
Figure 12.4b Feed on Offer Library entry for Mitchell grass sample of 3,340 kg/ha.
Source: AWI Feed on Offer Library
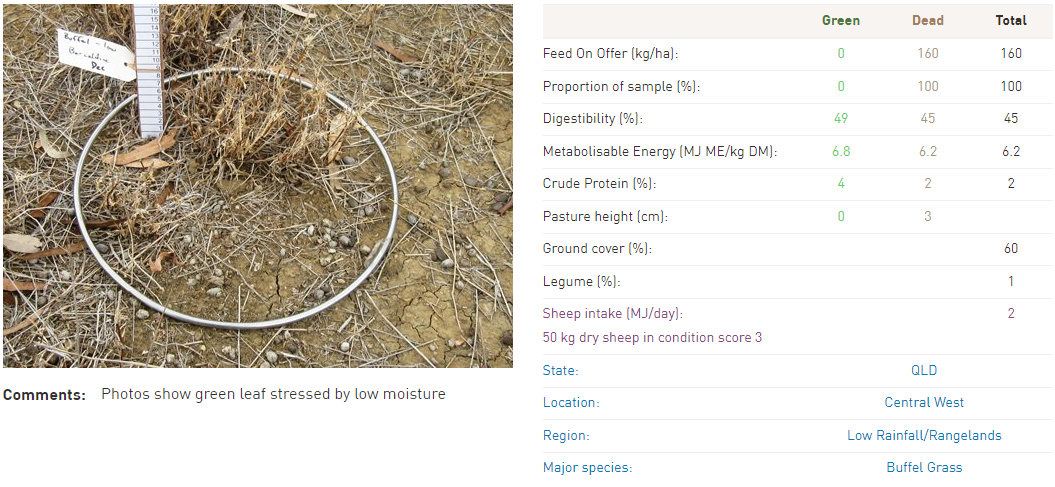
Figure 12.4c Feed on Offer Library entry for buffel grass sample of 160 kg/ha.
Source: AWI Feed on Offer Library
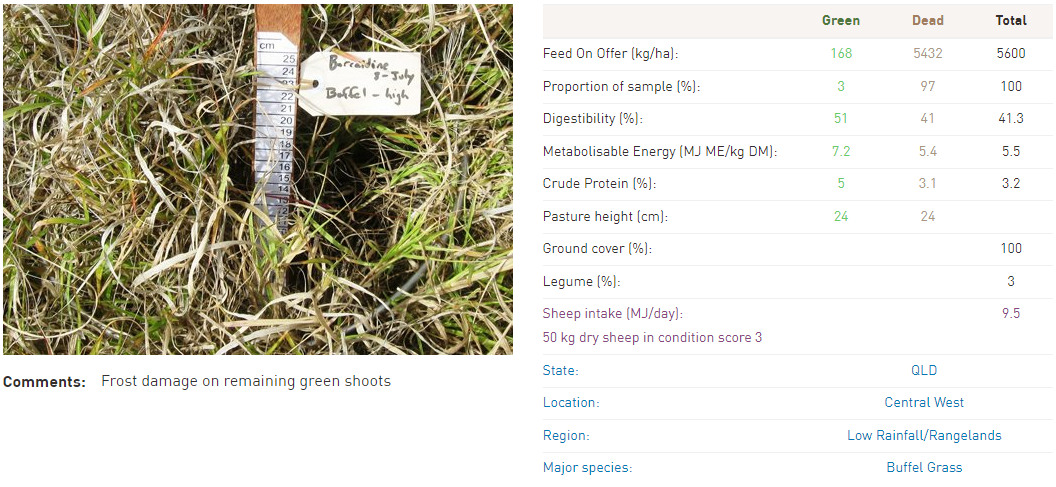
Figure 12.4d Feed on Offer Library entry for buffel grass sample of 5,600 kg/ha.
Source: AWI Feed on Offer Library
Different types of perennial grasses
Perennial grasses are extremely important in grazing systems and are a key focus for grazing management and landscape function; they assist in reducing wind and water erosion, provide litter for recruitment of new seedlings and are often the most responsive species to rainfall.
Native perennial grasses can be divided into warm and cool season grasses. Warm season grasses do most of their growing and seeding in the summer and are better adapted to high temperatures and light intensities. They are susceptible to frost and can be winter dormant. Cool season grasses grow and seed in the cooler months (winter/spring). They are frost tolerant, provide green feed during winter when temperatures are low and moisture is not limiting. In summer they have reduced growth and survive high temperatures and low rainfall by entering a drought-induced dormancy.
Cool season species tend to generate less bulk than warm season species. However, feed quality of cool season grasses is often higher than warm season grasses. The different types of perennials are responsive to rain at different times of the year. A pasture with both warm and cool season perennials will be rain ready throughout a greater part of the year than a pasture which is characterised by one type of perennial grass, which will be responsive at the time that best suits the single type of grass (e.g. winter).
| Warm season perennials | Cool season perennials |
|
*N.B. In drier regions and seasons this can perform more as an annual. |
Minerals and trace elements
Another important nutritional factor regarding the nutritional value of grazing plants is the level of minerals and trace elements that plants contain.
Even though old man saltbush (Atriplex nummilaria) has good levels of energy and crude protein, stock may not perform as well as expected due to the mineral and trace element imbalance. For example, the high salt level will require energy to be expended to excrete this through the kidneys. This issue can be further exacerbated when sheep are drinking water with a moderate or high salt content. Other saltbush species may lead to similar outcomes.
In a situation where lower production has been observed, consider the potential for mineral imbalances and possible options for remediation or supplementation to avoid significant production losses.
When stock are grazing species known to be of lower quality (e.g. speargrass), it is important that other species with higher levels of protein and energy are available to ensure high levels of production. It is widely known that when dry feed is available, only relatively small levels of green leaf are required to have significant impacts on the weight gain and wool growth of sheep. This is associated with the higher levels of metabolisable energy and protein present in the green material.
In the rangelands, this is often achievable if the plant community contains a mixture of annuals, perennials, grasses and shrubs.
Manage grazing pressure and monitor feed supply
It has been observed that the underlying driver of successful grazing management is the ability to manage stocking rates (grazing pressure) to match carrying capacity, regardless of the system that management is framed within. Stocking rate management, not grazing system, is the major driver of pasture and animal productivity and natural resource health.
In addition to actual grazing pressure, other elements of grazing management that are important (and can be managed) and will influence the productivity of the animals and plants in the system include:
- Rest period – the time when pastures are able to recover, build reserves and set seed;
- Graze period – length of time that grazing pressure occurs;
- Utilisation rates – how much of the feed on offer (FOO) is consumed; and
- Grazing variability – how evenly feed is consumed across the paddock.
Of course this is all dependent on when the rain falls, which species are present, the growth habit and pattern of the favourable species present.
Utilisation rate
Utilisation rate is the proportion of pasture available which is grazed by the animals present. Managing utilisation rate is an important part of grazing land management, particularly so in pastoral areas where vegetation communities are diverse yet fragile (if not managed well). Utilisation rate has a direct impact on both land condition and diet quality. Hence, good grazing management should focus on improving land condition, improving the evenness of utilisation and improving diet quality of the animals grazing.
A rule of thumb regarding safe utilisation rate for perennials in the pastoral areas is 20 to 30%. The remaining 70 to 80% will allow recovery post-grazing and ensure that the community of plants remains adequately resourced through root reserves and remaining biomass to recover after grazing. This is especially important in the event of a dry season.
There are photo standards for utilisation rates of perennial grass species in the Glovebox Guide to Tactical Grazing Management (see signposts below).
Monitoring total grazing pressure
There are a number of ways to monitor total grazing pressure.
A method of recording, such as a paddock management book or an electronic recording system (PC, tablet or smart phone) can be used to record dates and numbers of animals recorded in different paddocks. There are a number of smart phone apps available that are designed to assist in the recording process from the paddock. These can be readily found by searching the App Store or Google Play.
If total grazing pressure is not well managed, domestic stock will be competing for feed with a large, unmanaged feral or native grazing herd. This will have a significant effect on pastoral production. This becomes even more important in seasons when feed becomes limiting due to lower than ideal seasonal rainfall.
SIGNPOSTS
READ
USE
The FOO Library allows users to estimate FOO and nutritive value of grazed pastures.
ATTEND
A one-day workshop that gives producers a broad understanding of the environment in which they operate and the core principles behind successfully maintaining grazing land condition and long-term productivity.
Designed for producers to develop a thorough understanding of the grazing land environment in which they operate to strategically manage their grazing business to optimise land condition and productivity in the long-term and begin developing grazing land management plans for their properties.


