Chapter 8.1 Know your feed supply
Background information
When are the best, worst and most unreliable periods for pasture growth on your farm? Knowing the answers to these questions will help you make the right strategic decisions for your sheep enterprise.
The first and most critical step is to more reliably predict pasture growth across the year. Once you understand how pasture growth varies, you can:
- Match animal requirements to pasture production (see chapter 8.3)
- Achieve more precise and cost-effective supplementary feeding (see chapter 11.1 in MMFS Module 11 Healthy and Contented Sheep)
- Budget feed more accurately (see chapter 8.3)
- Manipulate pasture production and composition to meet the needs of your enterprise.
At a glance
- Know your feed supply curve
- Understand the variability of your feed supply curve, within and between years
- Identify and quantify opportunities to change your feed supply curve
To better understand your feed supply, construct pasture supply curves for your property and assess the variability between years. This requires knowledge of your annual rainfall and its variability, temperature patterns and your pasture types.
Review annual rainfall patterns
Annual rainfall and its distribution influence pasture growth. To review your annual rainfall pattern, graph your own average, long-term rainfall figures, or to find long term rainfall information, visit the Bureau of Meteorology (BOM) Climate Data Online website.
In ‘1: Selected: Monthly climate statistics’ section, for the first dropdown menu ‘Data about’ choose ‘Weather & climate’, then in ‘Type of data’ click ‘Monthly’ in the ‘Statistics’ area. Then select your relevant weather station and click ‘Get Data’. See example in figure 8.1.
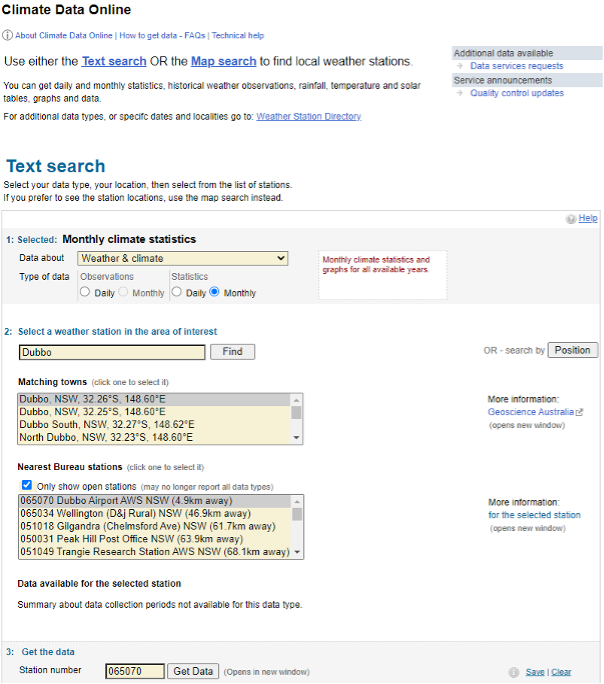
Figure 8.1: Example BOM Climate Data Online search page.
Source: Bureau of Meteorology
When the results load, in the ‘Rainfall’ section, click the Plot icon at the far right of the table to graph your Decile 5 (median) rainfall (mm) as shown in figure 8.2.
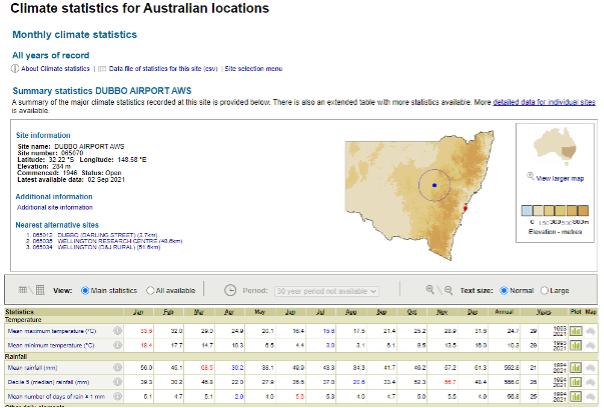
Figure 8.2: Example of where to access Decile 5 rainfall monthly climate statistics.
Source: Bureau of Meteorology.
What does the annual rainfall pattern look like in your district? Can your existing pastures use the rain whenever it falls? Could pasture types with growth patterns different to those of your current pasture types fill some seasonal feed gaps in response to rain?
See examples in figure 8.3 of median 5 rainfall in Dubbo NSW and Kojonup WA. The rainfall in Dubbo is historically evenly distributed across the year, so sheep producers could grow green feed almost all year round in response to rain, but this is much less likely at Kojonup with winter dominant rainfall.
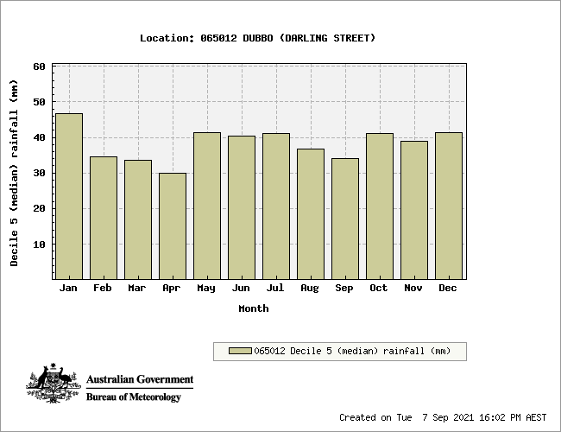
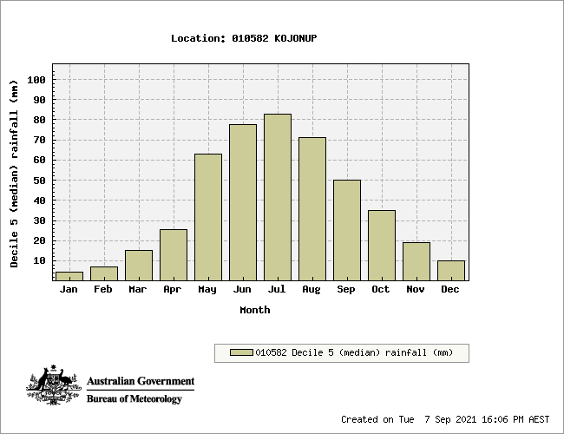
Figure 8.3 Median rainfall at Dubbo NSW (top) and Kojonup WA (bottom).
Source: Bureau of Meteorology.
Determine your current pasture growth pattern
On any farm there may be several different pasture and feed sources (annual pasture, native or introduced perennial grass pastures, lucerne, grazing cereals, forage crops and crop stubbles) that can provide forage at different times of the year. Figure 8.4 shows the growth of lucerne and sub clover-based pastures at Dubbo. Your total farm feed supply determines how well an enterprise and stocking rate will suit your growing season. However, it is important to also consider the quality of the pasture at different times of the year. For example, only a small area of lucerne might be required to grow out late winter born lambs in the Dubbo region.
There are several ways to use the pasture growth data. The first option is to plot on a graph similar to figure 8.4, the pasture growth of each of the main pasture types on your farm. This data together with information on the area of each pasture can be entered into the Feed Demand Calculator (tool 8.2) to generate an overall supply curve for your farm. In addition, the tool allows you to trial different stocking rates, lambing times, etc., and determine pasture deficits or surpluses.

Figure 8.4 Pasture supply curves for Dubbo, NSW. Summer active pastures can extend the growing season and provide land management benefits. Source: GrassGro®.
More information on pasture growth curves is covered in chapter 5.3 in MMFS Module 5 Protect Your Farm’s Natural Assets.
A second option is to manually work out the “average” pasture growth each month for your farm. See tool 8.1 for daily pasture growth estimates for common pastures by region. This is relatively easy where there are only 2-3 pasture types on a farm. For example, assuming the data in Figure 8.4 is from a 1,000 ha farm with 800 ha sub clover pasture and 200 ha of lucerne, the average farm pasture growth per hectare in January is:
|
Pasture Type |
Growth (kg/ha/day) |
Number of ha planted |
Total |
|
Sub clover |
5 |
800 |
4,000 kg/day |
|
Lucerne |
25 |
200 |
5,000 kg/day |
|
Total pasture growth for farm/day |
1000 |
9,000 kg/day |
|
|
Total pasture growth per ha/day |
|
9 kg/ha/day |
|
The same calculation can be undertaken for each month to determine the average pasture supply across the farm in an average year.

Figure 8.5 Average pasture growth curves (1965–2002) for four different environments. Kojonup, WA: annual pasture, good fertility; Bendigo, Vic: phalaris/sub clover pasture, good fertility; Armidale, NSW: native pasture (red grass)/sub clover, low fertility; Dubbo, NSW: annual pasture, moderate fertility.
Source: GrassGro®
A third thing to consider is the potential to use alternative pastures or forage sources to fill feed gaps. For the farm at Dubbo NSW shown in Figure 8.4, what options are there to graze cereals or use pasture growth promotants in July? Is there potential to use more summer active pastures to overcome feed gaps in summer? Local state agency staff or agronomists can provide advice on species to fill feed gaps. Chapter 7.3 in MMFS Module 7 Grow More Pasture also provides details of where to get information on pastures for different areas.
Finally, with the assistance of your consultant or advisor, use tools (such as the computer model GrassGro®) to get more specific data for your pasture species, soil types and soil fertility levels and how changes to these will influence pasture growth and quality.
Determine variability in your pasture growth
Pasture supply varies from year to year and between different locations. The variability of pasture growth between years is an indicator of risk and affects the ability to set an optimal stocking rate target or the reliability of a particular time of year for lambing (see figures 8.5 and 8.6).

Figure 8.6 Variability in annual pasture growth rates for Kojonup, WA (from DAFWA Woolpro sites and Pastures from Space) and native redgrass/ sub clover pasture, Armidale, NSW.
Source: GrassGro®
In figure 8.6, the 10% line represents the one-in-ten bad years (only 10% of all pasture growth records would fall below this line). The 50% line represents an “average” year (half of the recorded years were above and half were below this line), while the 90% line represents the boom seasons (90% of all pasture growth records would fall below this line) – only 10% of recorded year’s pasture growth would be above this year.
The closer all three lines are together in any one month, the less variability there is between years. In figure 8.6, the most reliable months at Kojonup are July-September and at Armidale December-February and June-July are most reliable. Autumn growth in annual pastures is variable at Kojonup, whilst spring is the most variable growth period for native pastures at Armidale.
To better understand your feed supply, construct pasture supply curves for your farm and assess the variability between years.
The simplest approach to constructing a pasture supply curve is to draw the growth curves for the main pasture types on a single graph.
Use the relevant tables in tool 8.1 to construct simple pasture supply curves for your farm. The estimates presented are only intended as a guide to help plan your annual feed availability. As an example, a pasture supply curve has been constructed for Dubbo NSW (figure 8.7) using the tables in tool 8.1.

Figure 8.7 Pasture supply curves for Dubbo, NSW. Summer active pastures in winter rainfall zones can extend the growing season and provide land management benefits.
Source: GrassGro®
On your whole-farm pasture supply curve, draw estimates of how much higher these lines might be above the average (the 1-in-5 best years) and how much lower the lines might be than average (the 1-in-5 worst years), using:
- Your experience, and/or that of your advisor.
- The Bureau of Meteorology Climate Data Online website provides historical weather details (see instructions for looking up your local data at the beginning of this chapter).
- The data in tool 8.1.
Tool 8.2 MLA Feed demand calculator describes how best to match animal demand to your pasture supply and minimise your exposure to risk from seasonal variability. The feed supply curve is generated as well as an inventory of stock demand across the year (all classes considering purchase, sale and lambing dates). Compare supply with demand to get a better understanding of when pasture will be in surplus or deficit and by how much. Use this information to set up your enterprises to better match available feed with animal demand.
Modify your pasture supply
Rainfall, temperature, soil moisture, soil type, fertility and pasture type combine to drive pasture growth. You can’t change your annual rainfall without moving, but you can rethink your existing pasture types and management systems to suit your location and achieve your enterprise goals.
MMFS Module 7 contains procedures to alter your pasture supply curves by:
- Building and maintaining soil fertility (chapter 7.1)
- Grazing to keep the desirable species productive and dominant (chapter 7.2)
- Establishing new pastures (chapter 7.3).
Supply gaps by can be filled in several ways. Use different pasture species and forage crops to provide out of season pasture growth. Figure 8.4 shows how lucerne can fill a pasture supply gap over summer/autumn in areas that receive summer rainfall. Lucerne and other deep rooted, summer-active perennials such as chicory can also prevent potential dryland salinity problems and protect the soil (see chapter 5.3 in MMFS Module 5 Protect Your Farm’s Natural Assets).
Nitrogen fertiliser can be used to boost pasture growth in winter and spring and is often more cost effective than using supplements. See tool 7.4 Guidelines for fertiliser applications for more information in MMFS Module 7 Grow More Pasture.
Growth promotants that contain gibberellic acid can be used to boost growth of pastures in winter when levels of this naturally occurring plant hormone are low. However, the additional growth in winter may be at the expense of spring growth. Information on how to fill the winter feed gap, including a tool to assess the likely response and cost effectiveness of using nitrogen and/or gibberellic acid can be found in signposts.
Changes to grazing management can also increase pasture growth. Rotational grazing systems that allow higher pasture availability during autumn and winter can increase pasture growth rates by 10-20% compared to set stocked systems. For more information see signposts.
Supplementary feeds can also be used to fill feed gaps and harvesting hay or silage can also use some of the excess pasture available in spring. Ensure that the supplements that you intend to use are adequate for the class of stock being fed. The GrazFeed program or information available through the Lifetime Ewe Management course can assist in making better use of supplements.
Deferred grazing through containment feeding
Establishing additional leaf area on pastures immediately after the break of season can significantly increase pasture growth rates leading into the growing season, and total pasture production for the remainder of the season. This can be done through holding stock within containment areas on a full ration. Low-cost rations utilising hay or high-quality straw can be supplemented with grain or silage to meet animal requirements through this period. The length of time, and therefore cost, of containment feeding will be determined by seasonal conditions and should be reviewed annually. Allowing pastures to reach 1,000 kg of feed on offer will provide them with the opportunity for optimum plant growth rates.
Utilise cereal crops
On mixed farming enterprises, crops can be another source of feed for livestock enterprises. A range of cereals can be utilised by livestock without impacting on profits or the crop. Across the southern states in the Grain & Graze project, benefits of grazing cereals to fill a feed gap are apparent. The Grain & Graze trial in Western Victoria (see signposts) showed grazing Yerong barley at the vegetative growth stages up to stem elongation:
- Had no adverse effect on eventual grain yield and even improved yield slightly
- Reduced stubble levels slightly, promising easier sowing in the following season
- Reduced the need to graze new or re-germinating legume pastures in early winter
- Gave 4-6 weeks grazing in the colder part of the year when pasture growth was slow
- Contributed 16% of the total feed requirement for the year.
It is your total farm feed supply curve and its variability that indicates how well an enterprise might be suited to your growing season. Revisit your annual livestock management calendar (see chapter 8.2) and your business plan (tool 1.3 in MMFS Module 1 Plan for Success) now that you know your feed supply and how it varies within and between years. It may be possible to address livestock needs with addition of other plant species to provide pasture of the quality and quantity required for the production goals (e.g., growing out weaners, finishing lambs, etc.). Alternatively, a more cost-effective option is to revisit your enterprise structure (the number of breeders and trading stock carried), as well as reviewing your target market. For example, a better option in some locations without a summer feed supply, may be to sell lambs as stores rather than taking them to heavier weights.
SIGNPOSTS
READ
The AWI website has a series of publications on managing drought recovery.
A practical guide to assist woolgrowers recover from drought, covers pasture utilisation through flock fertility and weaner management to genetics; all important components of flock recovery strategies.
Information on how to fill the winter feed gap, including a tool to assess the likely response and cost effectiveness of using nitrogen and/or gibberellic acid.
Successful graziers use a range of grazing techniques and varying approaches according to the needs of their sheep and pasture throughout the year (or a series of years).
Provides a range of statistics, weather observations and other climate data for Australian locations from the Bureau of Meteorology.
USE
Assists sheep producers proactively manage the nutrition of their ewe flock through the reproduction cycle utilising condition scoring and feed on offer (FOO) assessments.
Assists sheep producers proactively manage the nutrition of their ewe flock through the reproduction cycle utilising condition scoring and feed on offer (FOO) assessments.
Develop a drought feeding strategy for sheep or cattle by determining feed requirements for different sheep age groups and pregnancy or lactation status.
Develop a drought feeding strategy for sheep or cattle by determining feed requirements for different sheep age groups and pregnancy or lactation status.
The Calculator has been designed as a guide for producers to estimate the number of grazing days for adult sheep on wheat stubbles, based on the level and timing of supplementary feeding required in each individual scenario.
The FOO Library allows users to estimate FOO and nutritive value of grazed pastures.
Information on how to fill the winter feed gap, including a tool to assess the likely response and cost effectiveness of using nitrogen and/or gibberellic acid compared with the cost of common supplementary feed types.
ATTEND
The course is delivered in small groups of 5-7 sheep producers that meet six times per year with a professional trainer. During these hands-on sessions, the group visits each participating farm and learns skills in condition scoring, pasture assessment and best practice ewe and lamb management to increase reproduction efficiency and wool production, mainly through reducing ewe and lamb mortality.
The program has five packages covering different topics. Grazing management is covered in ‘Grazing fundamental EDGE’ and ‘Grazing land management EDGE’.
Producers follow the program for a 12-month pasture production cycle to learn a set of guiding principles to manage pastures confidently regardless of the season, situation or system.
This package was developed to upskill producers in utilising satellite imagery to develop grazing budgets on a large scale.
Provides producers with the skills to grow and utilise more pasture whilst learning to be less reactive, more proactive and to better manage risk.