Chapter 9.3 Breeding tools help business decisions
Background information
When you know what fit for purpose looks like for your livestock, you can work to optimise production and profitability by concentrating on the genetics and the environmental conditions the animal is exposed to. There are several useful breeding tools available to help you with decision making. Which of these tools are best suited to you will depend upon your objectives and particular circumstances.
At a glance
- The animal you breed is a combination of its genetics and the environment, which includes management.
- Tools exist to help you make breeding decisions.
- Breeding takes time and patience is required to realise change.
An animal’s performance is influenced by its genetics and environment
How a sheep looks and how it performs (phenotype) is a combination of the genes (genotype) it carries and the environment in which it has been raised and managed.
Genes will express themselves to a varying extent depending on the non-genetic or environmental factors.
You can influence the phenotype over time by manipulating the genetics of your flock through breeding and by managing the non-genetic factors such as feeding and management.
When we talk about ‘environment’, we’re really talking about all of the non-genetic factors or aspects that impact the animal’s performance that are not due to their genes.
A good example of this is the variation you see in fibre diameter when a sheep is raised in one location then moves to a different environment and receives different nutrition, which makes their wool present as broader or finer. The genotype of the sheep hasn’t changed, but the environmental factors are changing how the genes are expressed.
What is important to understand is that an animal does not pass on the environmental or non-genetic effects to its progeny, it only passes on its genes.
There are a lot of non-genetic factors that have a large impact on the phenotype, or how an animal looks and performs. While these are also called environmental factors, they extend well beyond what you may normally consider to be ‘the environment’ (such as climate and feed availability), to include the age of the ewe, whether the lamb is born early or later in the lambing period, how long the lambing period was, whether they’re born or raised as a single or multiple, management groups and disease exposure, to name a few.
Some of these non-genetic factors that impact individuals are known and can be accounted for in genetic benchmarking and sheep classing, while others remain a mystery but still contribute to the natural variation we see between animals. Some examples include: ewe milk quality and quantity; the lamb early weaned itself; the lamb got stuck in a dam or fence; one-off disease impacts; social interaction in the mob.
An example of the effect of environmental factors is that progeny born in a drought with poor nutrition often look and perform differently to progeny born in a good year, even though they are genetically similar. Those born in a drought may be lighter, cut lower quality wool, have poorer meat-eating quality and express less wrinkle compared to those with the same genes born in a good year. Despite this difference in performance, if they are genetically identical to animals born in a non-drought year, they will pass on the same genes to their progeny.
Another example is that single born lambs generally look and perform differently compared to twin born lambs, even though they may have similar genetic potential, due to the additional nutrition they receive in utero and during lactation. A twin born lamb may have some inferior phenotypic production traits but may, in fact, be genetically superior to the single born lamb.
Environmental factors mean that how an animal looks is not always a good indicator of its genetic merit or what it will pass on to its progeny. An example of this is that sheep that are genetically predisposed to fleece rot may not show fleece rot in a dry year.
Decisions are long-term
Genetic improvement takes time and patience but is cumulative.
When examining a specific trait or characteristic in any flock, the majority of the flock will be clustered around the 'average'.
The average represents the flock's genetic merit for a trait. Genetic improvement or gain occurs when the genetic merit is improved through selection.
The improvement in genetic merit refers to the overall improvement in a flock brought about by selection for a number of traits that contribute to the flock's breeding objective.
While the ram and the ewe contribute 50% of the genes each, their influence over the whole flock is vastly different, with one individual ram contributing many more lambs to the flock over his lifetime than one ewe. For this reason, one ram has a much greater impact on the long-term genetic profile of the flock than one ewe does.
Furthermore, a ram’s genetic influence within a typical self-replacing flock lasts much longer than the four joinings for which he will normally be used. This is because:
- Breeding ewes with 50% of a sire’s genes (daughters of the ram) are likely to be still breeding 10 years after the ram was first used.
- Breeding ewes with 25% of a sire’s genes (granddaughters of the ram) are still in the system up to 16 years after the ram is first used.
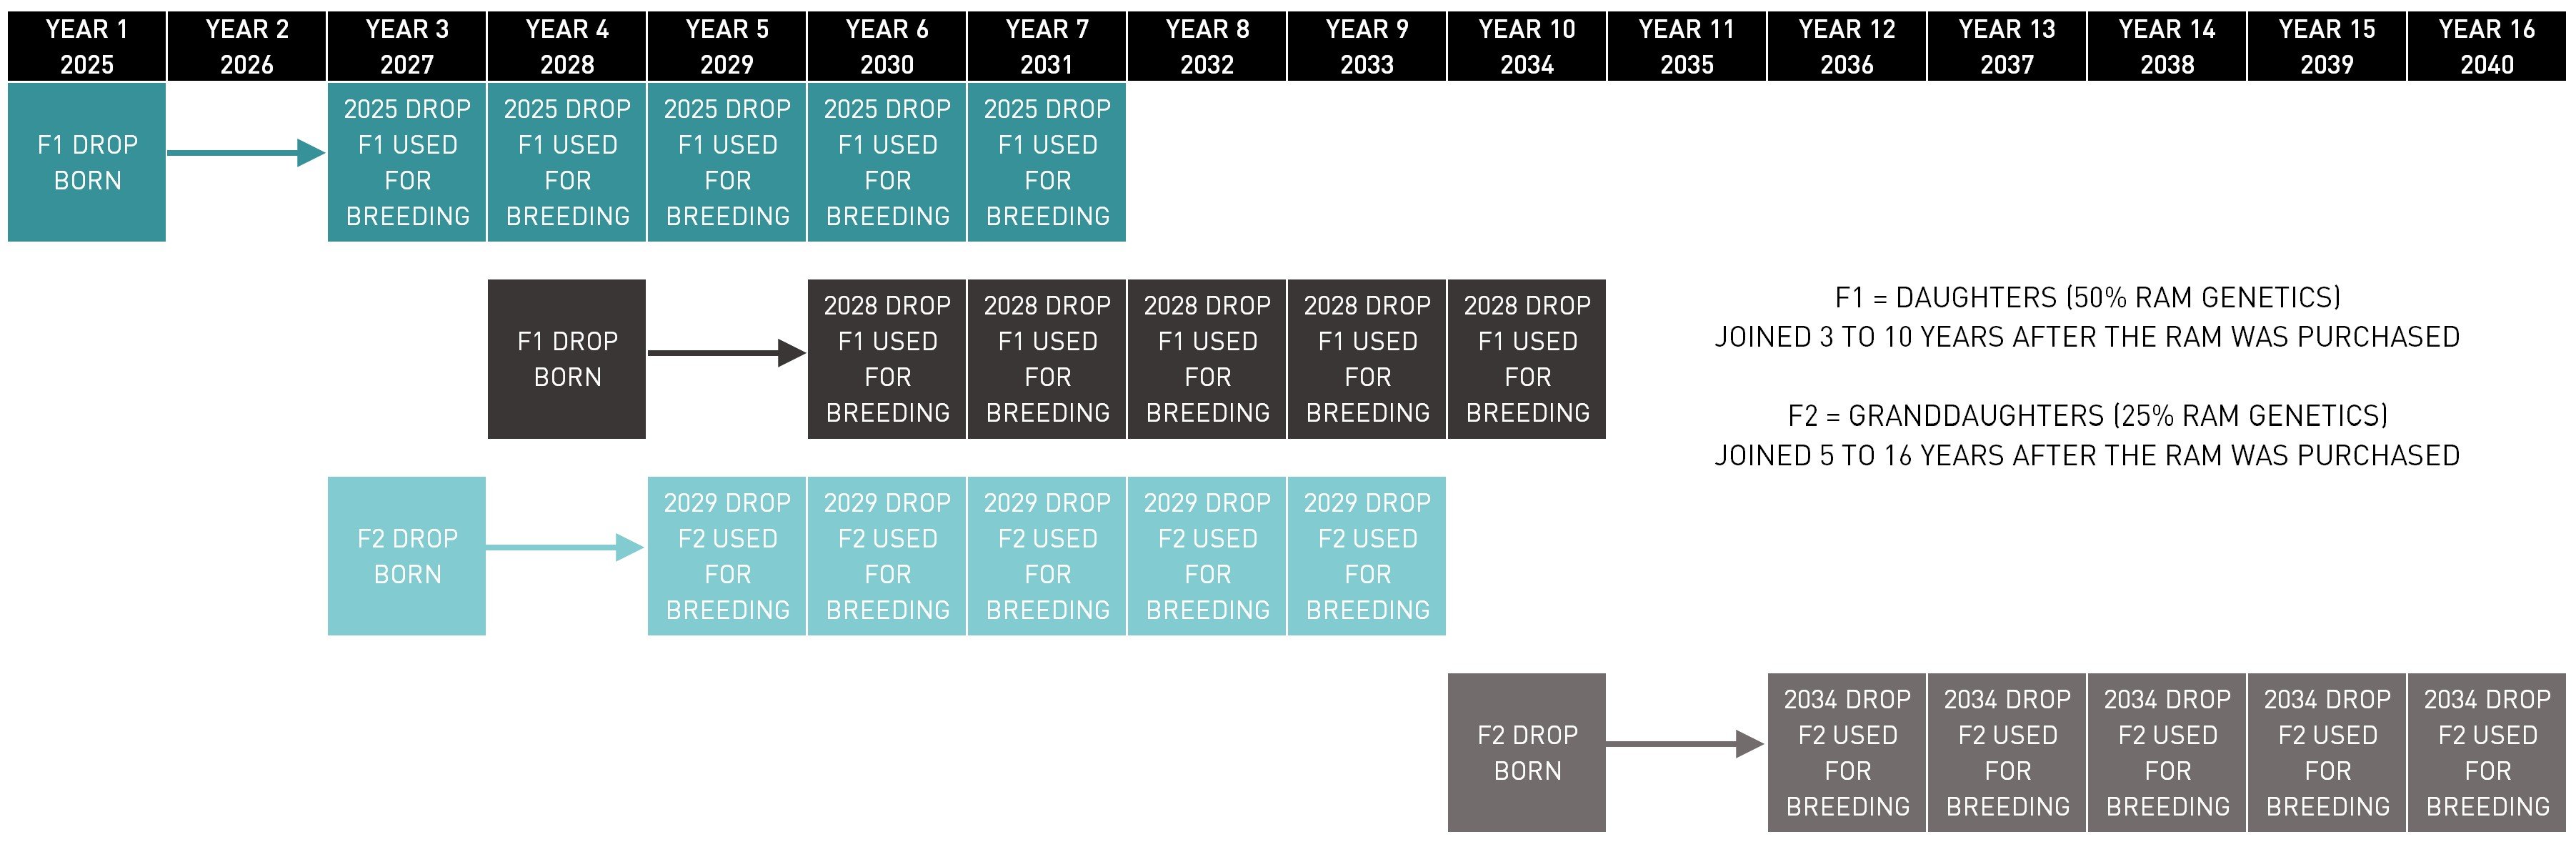
Source: AWI
This is why it’s so important to make strategic and informed breeding decisions and ensure you’re choosing sheep that are fit for purpose – your classing, selection and joining decisions have a tangible, long-term impact.
Genetic gain requires dedication and patience. While the amount of gain you can realise depends on many factors, including your starting point relative to what you are seeking to achieve, gain is typically about 1-2% per year, but is cumulative, so have a plan and stick to it. This is particularly important when you are seeking long-term goals such as reducing dag or improving reproduction.
The most effective approach to achieving genetic gain through breeding involves:
- being accurate in your selection decisions (selection accuracy);
- selecting the best animals more often (selection intensity); and
- balancing this with the age structure of your flock (generation interval).
There are a number of genetic principles that can be exploited to help you along the way.
Genetic principles
Variation
There is natural variation within the traits of your sheep.
If you want to improve the overall performance of your flock, you need to identify the differences or variation between sheep in your flock and decide what you’ll do based on these differences.
Most traits that are selected for in the sheep industry are what called “normally distributed”. That is, they fit into a bell curve shape with most animals around the average and few making up the top and tail of the curve.
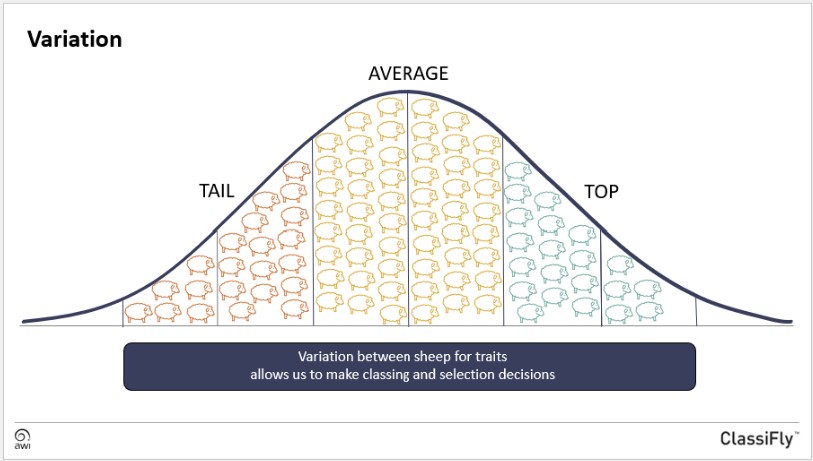
The width of the curve tells us how much variation there is for the trait and the greater the variation, the easier it is to identify the top animals for breeding and to cull the lower merit animals.
The distribution on the curve, or how wide or flat the curve is, will vary from trait to trait and between traits.
Due to variation in traits, we can make progress towards a particular favourable trait by identifying differences in the expression of the trait and choosing the better ewes and rams to produce the next generation.
Heritability
If a trait is heritable, it means the trait can be passed onto progeny. Some traits are more heritable than others.
If a trait is highly heritable it means an animal’s genetics has a relatively large impact on the expression of the trait in their progeny and the impact of the non-genetic or environmental factors is relatively small.
High heritability - fibre diameter
The expression of the trait or what we measure in the progeny is largely (60%) due to the genetic merit of their parents and only 40% due to non-genetic factors. This is why the industry has been able to shift micron relatively easily.
If a trait has low heritability, it means that non-genetic (environmental factors) have a larger impact on the expression of the trait.
Low heritability - conception
This trait is largely influenced by non-genetic or environmental factors (greater than 90%), such as ewe nutrition, which means that conception is due only to a small degree to the genetic merit of their parents.
Progress can be made with all traits that are heritable so it is still worth selecting for more lowly heritable traits that are important profit drivers in your enterprise as genetic gain is cumulative and permanent, you will just need to be more diligent in assessing sheep and know that it will take longer to make genetic progress.
Good management and husbandry which allow for variation in traits to be expressed are important to making genetic progress, especially for traits that have lower heritability. For example, though growth rate is moderately-highly heritable, providing optimal nutrition is still required for genes for high growth rates to be expressed and variability to show.
Correlations
When traits are influenced by the same or closely related genes, they are correlated. This generally means that changing one trait will change the other, although the strength of the interaction and impact between one trait and another can vary.
Correlated traits can also be used as indicator traits when the trait you are interested in cannot be easily measured or assessed or is difficult to see.
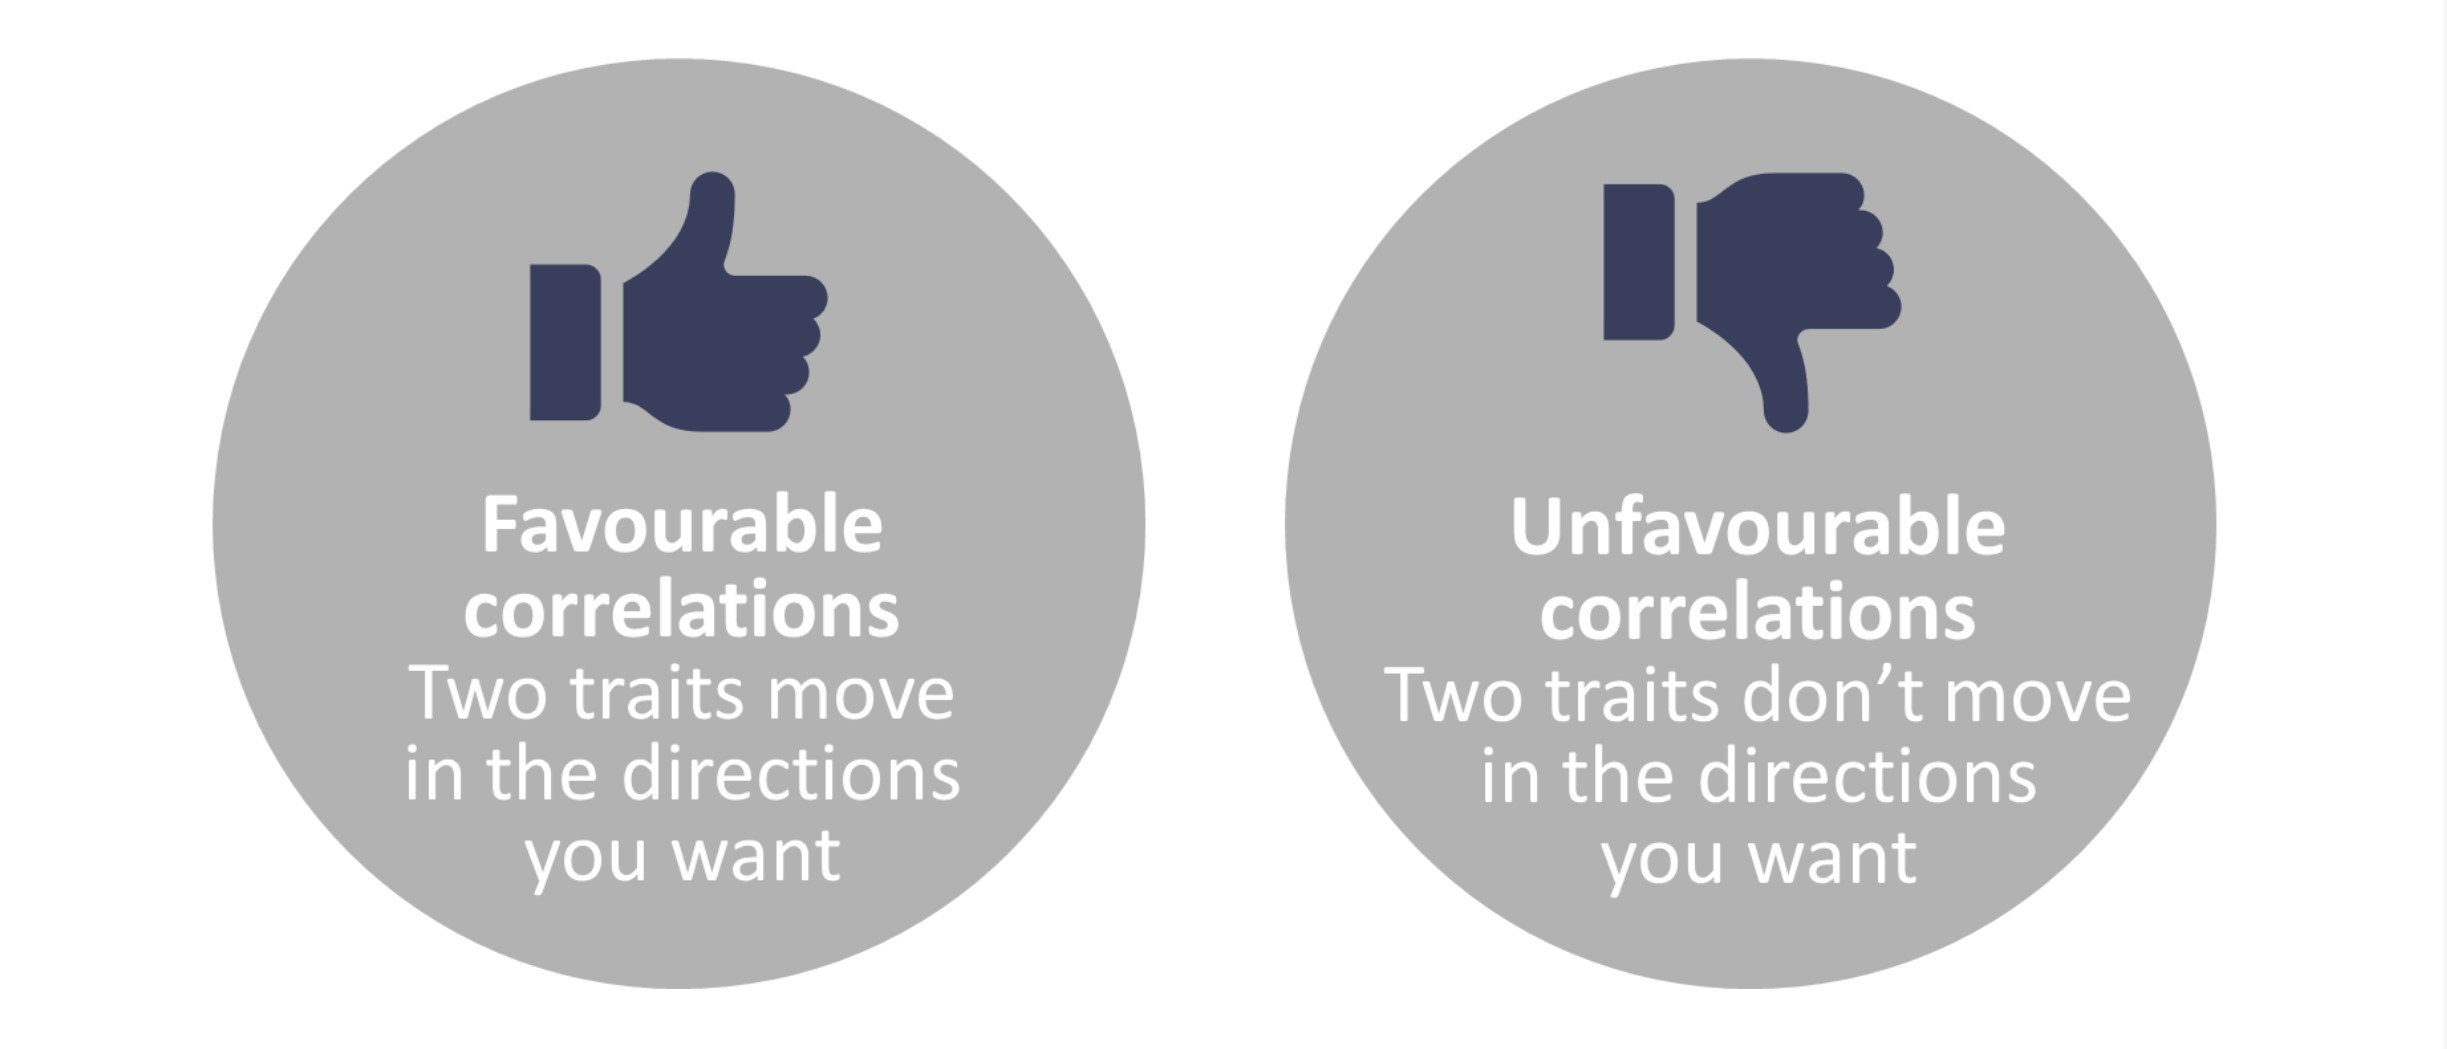
Correlations can be favourable or unfavourable.
Favourable correlations occur when two traits both move in the directions you want them to.
Favourable correlation - liveweight and fleece weight
As liveweight increases, fleece weight tends to increase as well.
Unfavourable correlations occur when you have one trait that moves in the direction you want it to but another trait that moves in a direction you don’t want it to.
Unfavourable correlation - lean meat yield and intramuscular fat
When lean meat yield increases, intramuscular fat generally decreases. Another example of this is as fleece weight increases, fibre diameter does as well, which may not be desirable.
When lean meat yield increases, intramuscular fat generally decreases. Another example of this is as fleece weight increases, fibre diameter does as well, which may not be desirable.
There are some sheep that bend unfavourable correlations and these are the ones to look for if those traits are important profit drivers for your enterprise. Such sheep are sometimes called ‘curve benders’.
Although you can improve a trait indirectly by focussing on a correlated trait you will have both greater and faster outcomes if you focus directly on the trait you are interested in rather than relying on the correlation.
Decision support tools
Useful and practical decision support tools can help direct your investment in the right genetics. Several tools assist with decision making:
- visual assessment
- raw measurements, such as:
1. Visual Sheep Scores
2. wool performance records
3. weight and growth performance records
4. carcase performance records
5. reproduction performance records
- breeding values:
-
- RAMPOWER
- Flock breeding values (FBVs)
- sire evaluations
- Australian Sheep Breeding Values (ASBVs)
- Flock Profile (via DNA testing)
Visual assessment
Visual assessment relies on assessing how each trait is phenotypically expressed in an animal; that is, what they look like and how they perform.
You can visually assess a number of traits when classing for lifetime productivity and profitability as well as for breeding better progeny.
Good protocols are important in assessment, whether this be visual or measured. These should include: tight lambing, identifying multiples and maiden progeny, maintaining as few management groups as possible for a drop/mob, the right timing when to take each assessment, a good husbandry and animal health program, and maintaining best practice commercial condition scores.
Raw measurements
Raw data is an assessment of an animal’s actual performance and can include visual assessment, performance records or a piece of information about the animal that will help establish its usefulness to your breeding program.
You can use this information when making classing and selection decisions. For example, looking at liveweights or wool test results.
The more raw data collected and used when making decisions, the more accurate classing and selection decisions will be.
Visual Sheep Scores
To help with visual assessment, AWI and MLA developed the Visual Sheep Scores guide that has good visual representations of a range of traits, scored on a scale of 1-5.
This provides consistent language, scoring and examples of the expression of some of the most common and useful traits in sheep.
The guide allows you to score your sheep consistently using the same approach and metrics.
Performance records
Performance records are any records that may help you gain an understanding of how your breeding enterprise is performing before and after implementing a breeding strategy. This should be linked to your business objectives and profit drivers (chapter 1.1 in MMFS Module 1 Plan for Success).
Performance records may include reproductive performance measured through marking or weaning percentages and ewe mortality, and meeting market specifications, measured through carcase data and wool clip data, for example (see tool 1.10 in MMFS Module 1 Plan for Success).
Measuring wool production performance
Wool production performance can be measured and monitored through your wool clip results.
Maintain records of wool production performance overtime and monitoring for changes as a result of breeding decisions.
Measuring carcase performance
Carcase performance can be measured and monitored through feedback from the abattoir typically in relation to market compliance, age/dentition, intramuscular fat, lean meat yield and disease and defect conditions.
Maintain records of carcase performance overtime and monitoring for changes as a result of breeding decisions.
Measuring reproductive performance
Reproductive performance can be measured and monitored by looking at:
- The number of ewes scanned pregnant compared with the number of ewes joined (ewes scanned in lamb percentage, also called conception rate).
- The number of foetuses scanned in relation to the number of ewes joined (the scanning percentage).
- The number of lambs marked compared with the number of lambs scanned (lamb survival percentage)
- The number of lambs marked compared to the number of ewes joined (lamb marking percentage).
- The number of lambs weaned compared to the number of ewes joined (weaning percentage).
- The number of weaners at 12 months compared to the number of lambs weaned (weaner survival percentage).
These measures will give a good idea of the flock’s reproductive performance so that areas for potential improvement can be identified.
Be consistent with the methodology you use to measure performance to gain a true picture of improvement towards your targets over time. See tool 1.10 in MMFS Module 1 Plan for Success for business, financial and enterprise benchmarks you can use in your analysis.
Breeding values
Breeding values are a prediction of an animal's genetic merit for a particular trait. Genetic merit refers to how an animal ranks against other animals for its ability to produce progeny with superior traits. They are an indication of how an animal's progeny will perform based on the genes they will pass on.
The values are derived from an analysis that adjusts the raw data for non-genetic factors, such as birth type and dam age. It also accounts for known genetic factors including the correlations between traits and heritability.
There are some commercial tools that are available to predict genetic merit for either a flock or individual animals:
- RAMPOWER
- Flock breeding values (FBVs)
- Sire evaluation
- Australian Sheep Breeding Values (ASBVs)
- Flock Profile (via DNA testing)
RAMPOWER
Commercial Merino flocks can use RAMPOWER, a within-flock analysis program. To use this program, producers collect raw measurements on a group of their sheep that have been managed the same way (no adjustment is able to be made for environmental factors) and analyse this information using well-established industry genetic parameters (e.g., heritability and correlations). RAMPOWER generates a single value (within-group indexes) to allow sheep to be compared to their cohort but is not comparable to other flocks as no environmental adjustment has been accounted for.
Flock Breeding Values (FBVs)
FBVs benchmark animals that are run on the same site and mostly within a drop of animals. These are only comparable within the flock and are different to the flock profiling test that is available for commercial producers. More information on flock profiling as a benchmarking tool will be covered later.
You might see FBVs reported at sire evaluation days or provided for rams at some ram sales.
Sire evaluations
Merino sire evaluations provide an independent comparison of the breeding performance of rams by evaluating their progeny relative to the progeny of other sires and in particular, link sires. Link sires allow sires entered at different sites and in different years to be compared by removing the differences between sites, years and seasons, leaving only the genetics to be evaluated via the progeny. This data is also used to strengthen across-flock linkage, which helps underpin ASBVs.
The progeny of different sires are managed at a range of sites under consistent management protocols and a large number of traits of commercial importance to producers are measured. The results are used by ram breeders to benchmark their genetics in a specific environment and by ram breeders and buyers alike to assist them to select the genetics that will add the most profit to their enterprises.
Sire evaluation sites are located throughout the major wool-growing regions of Australia with the progeny of between 12 and 20 sires used at each site. Sires are joined to ewes via artificial insemination (AI).
The ewes at each site are selected to create an even, classed line that is representative of sheep typically run in that environment. An equal number of ewes are joined through AI to each sire. The minimum number of ewes joined to each sire is 50, with some sites choosing to join more.
Evaluation of a sire’s progeny is the key to sire evaluations. Progeny are managed together under the same conditions throughout the period of the trial, with the exception that single and twin bearing ewes can be separated prior to lambing and managed accordingly up until tagging or weaning. All progeny are evaluated to hogget or adult age with no culling, except for welfare purposes, to enhance the understanding of later age stages.
The performance of progeny may be evaluated at many stages in the trial, depending on the traits of interest.
Evaluation involves both measured traits and visual assessment.
Reports are published for each site which provide information on traits including:
- wool, growth and carcase traits;
- breech and conformation traits; and
- internal parasite resistance.
The results are presented as Adjusted Sire Means for each sire, which adjust the raw data for effects such as being born or raised a single or a twin, as well as Flock Breeding Values (FBVs).
ASBVs
ASBVs have been developed to take some of the complexity out of decision making and help you make selection decisions more accurately. ASBVs go hand in hand with visual assessment of animals and help improve selection accuracy.
Ram breeders report information to Sheep Genetics on the performance of their sheep for a wide range of economically important traits to a centralised database on a regular basis. This data is analysed along with genomic information to benchmark animals across flocks taking into account the known non-genetic factors, such as ewe age, birth type and rear type, so that selection decisions can be more accurate.
ASBVs compare the genetic performance of sheep across flocks and have been developed for Merinos (MERINOSELECT), Dohnes (DOHNE) and Terminal and Maternal breeds (LAMBPLAN). These are calculated and then published by Sheep Genetics and provide an estimation of an animal’s genetic merit or what they will pass onto their progeny. They do this in consideration of the animal’s own performance data as well as the performance data of any known relatives in the database, including parents, siblings, progeny and other relatives.
Genomic testing involves analysing an individual animal’s DNA, along with phenotypic data, to more accurately predict ASBVs. This is useful for better understanding the exact DNA that has been contributed to an animal from its relatives. It is useful if there is limited data measurement available on young rams as genomic testing can significantly increase the accuracy of ASBVs on younger animals, potentially allowing for faster genetic gain.
ASBVs also account for the concepts we’ve looked at so far, such as heritability and correlations, as well as non-genetic factors (known environmental factors), such as birth type, to determine an animal’s genetic merit for a range of important traits.
Most ASBVs are reported and displayed with the same units used to measure the trait. For example, the ASBV for fibre diameter (FD) is reported in microns, the ASBV for weight (WT) is reported in kilograms and the ASBVs for traits that are measured in scores are reported using scores. Some traits, like clean fleece weight (CFW) and fibre diameter coefficient of variation (DCV) are provided as percentages.
Selection indexes
There are a significant number of ASBV traits reported by Sheep Genetics and many of these are correlated to other traits to varying degrees.
Indexes help you select animals for use within a breeding program when there are many traits of importance. Indexes combine important production traits into a single value and are a useful way to rank animals quickly and easily. Using indexes in your ram purchasing decisions allows you to make balanced genetic progress towards more profitable sheep for your production system. A ram with a higher index will produce progeny that are more profitable in that production system. There are a number of indexes available for each of the analyses.
It’s important to use the index that:
- is most relevant to your production system and your breeding objective; and
- puts emphasis on your economically important traits.
Always consider individual trait ASBVs even when using an index to ensure you are selecting genetics that will meet your objective.
For example, if you are interested in eating quality and live in an environment where internal parasites are an important economic trait, the Lamb Eating Quality (LEQ) index, which takes into account Worm Egg Count (WEC), would better align with your production goals than the Eating Quality (EQ) index, which does not include WEC.
Decision support trees can help you determine the most appropriate index for you.
These list the characteristics of the production system in each chosen index and explain what the change in direction will be if used to make selection decisions.
There may be traits of interest to you that are not included in an index or that require different prioritisation. Once you have chosen the index which is the closest fit for you, you can use this a drafting gate before focussing further on the traits of particular interest to you.
When it comes to using an index in your purchasing decisions:
- Rank animals using your chosen index.
- Consider the individual ASBVs which are important in your breeding objective to further short list animals.
- Make sure those animals meet your structural and type requirements through visual assessment.
Flock Profile (via DNA testing)
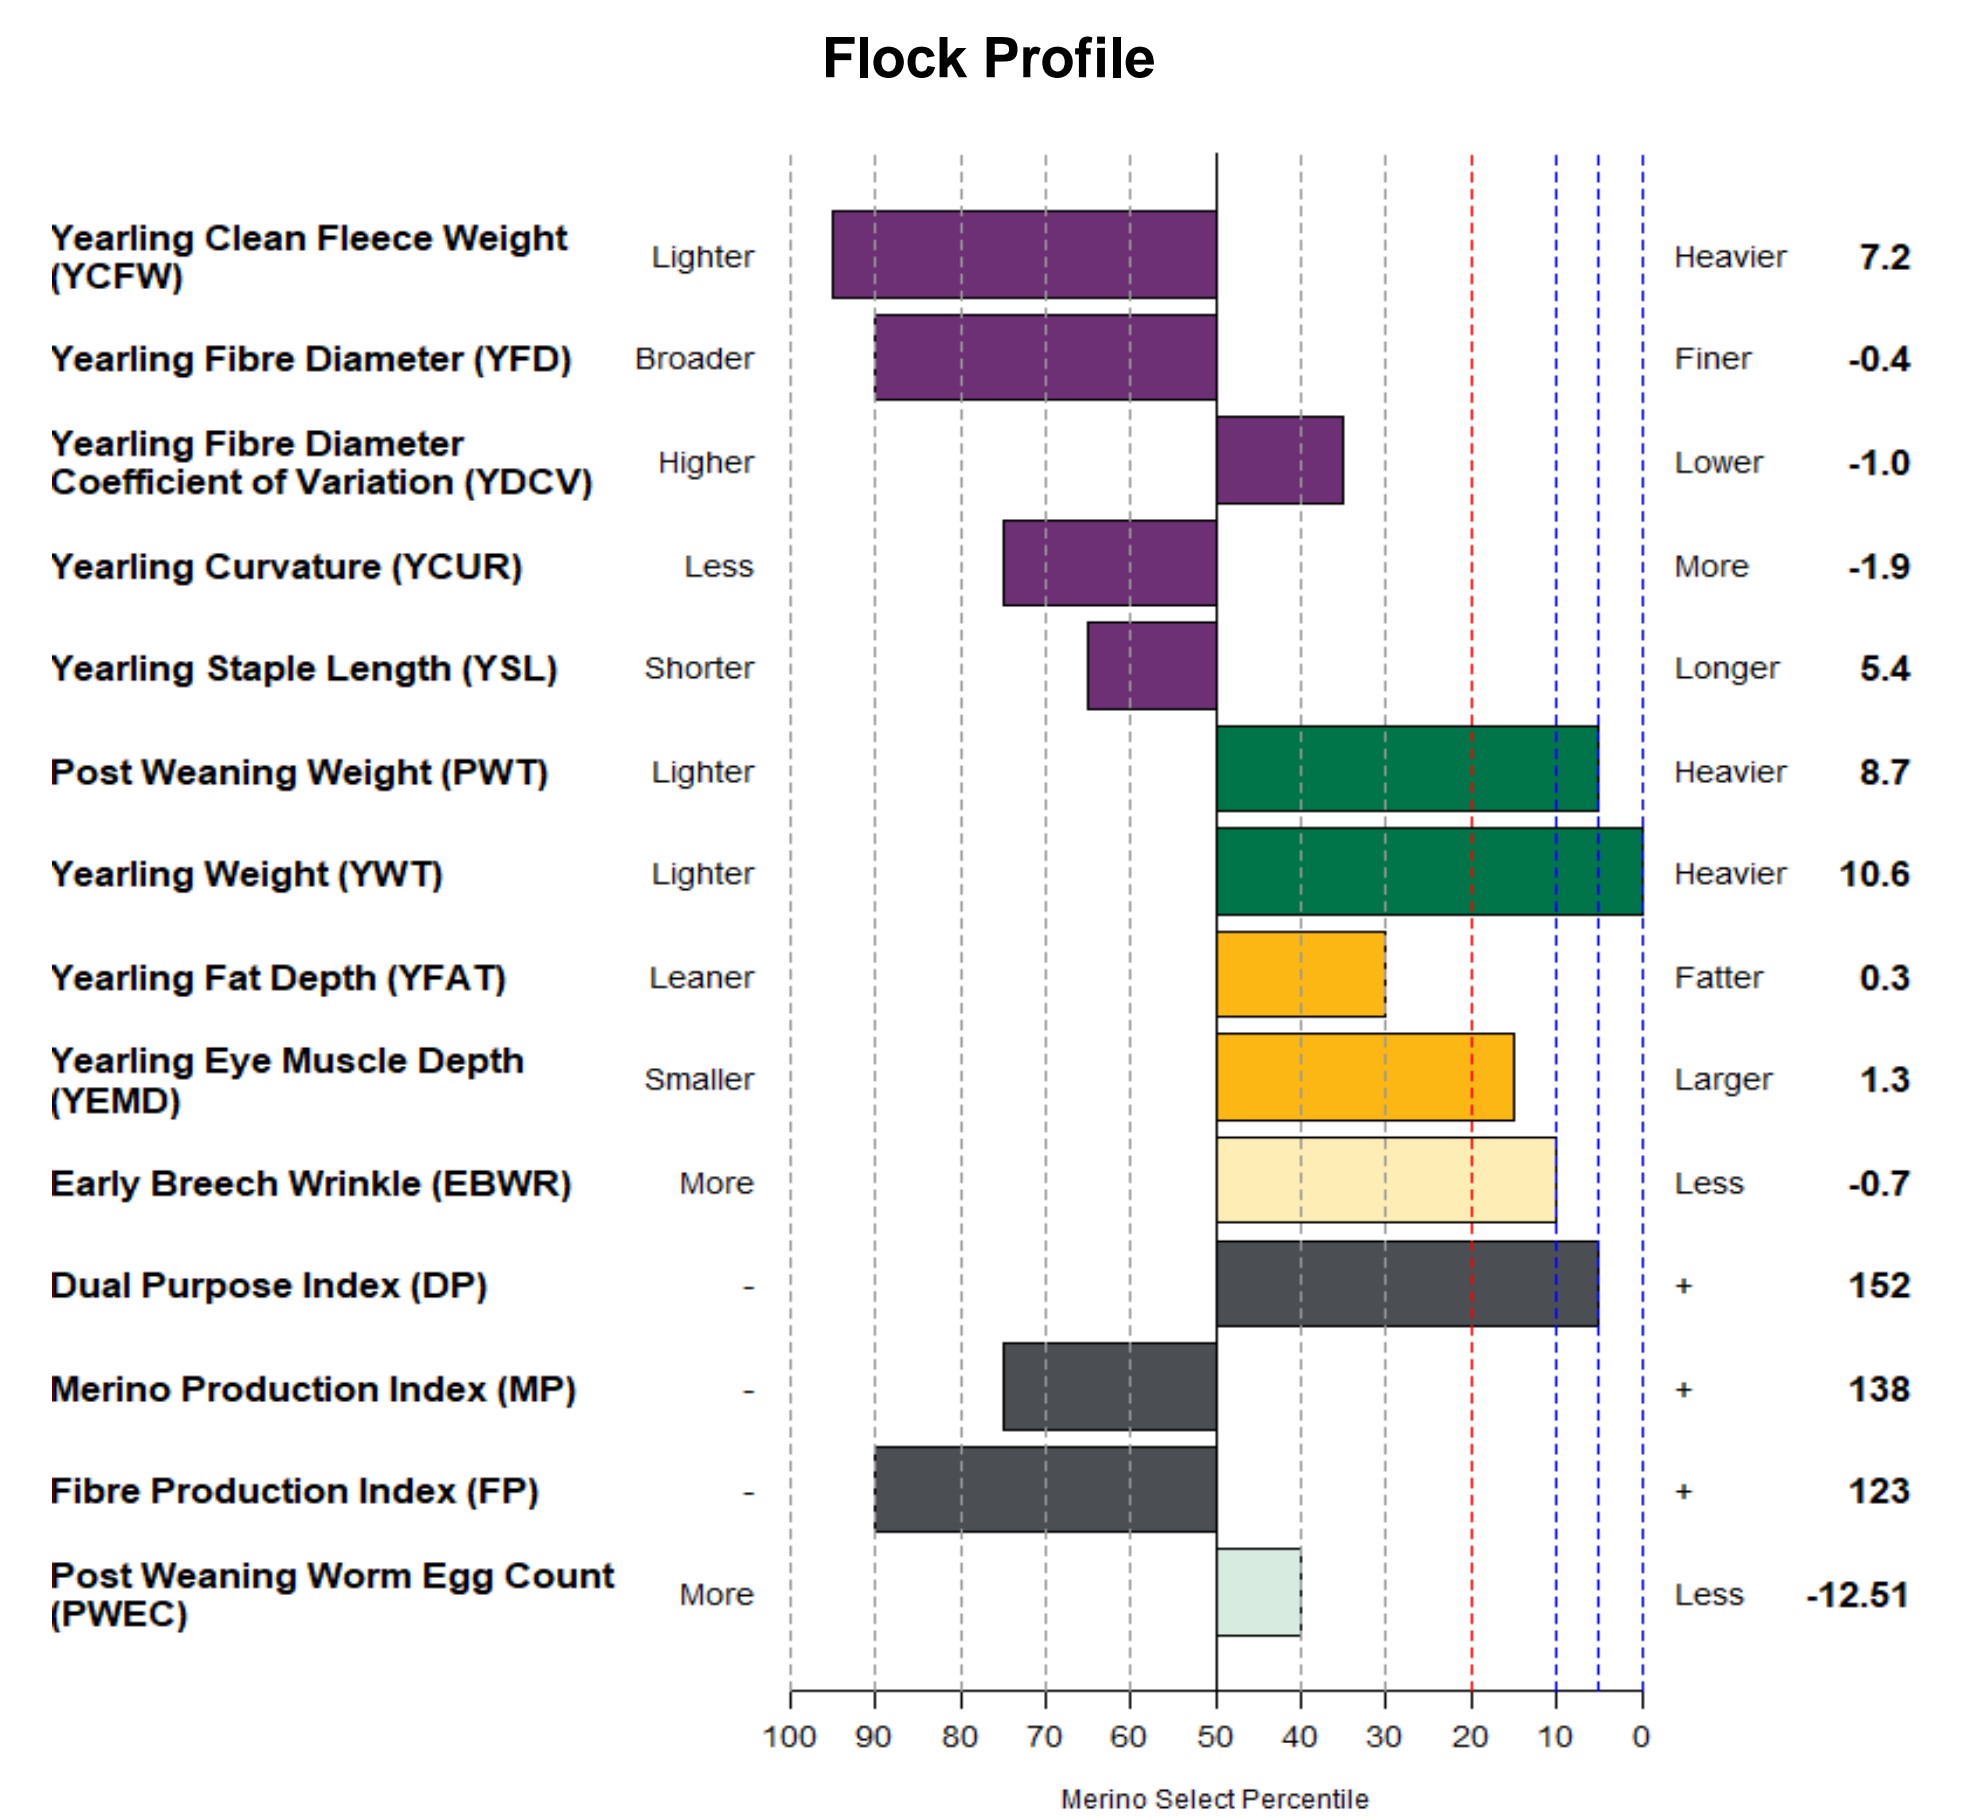
If your rams do not have ASBVs, you can establish your flock’s position in ASBV terms through flock profiling.
Flock Profile is a service offered by Sheep Genetics for Merino flocks where a DNA test is carried out on 20 randomly selected maiden ewes to benchmark the flock in ASBV terms against industry percentiles. Results for your flock will be provided as ASBVs.
Flock profiling requires bloodlines to be well linked in the ASBV database to generate accurate results. See signposts for more information on Flock Profile and contact details of experts you can discuss your situation with to decide if this is right for your flock.
SIGNPOSTS
WATCH
A series of short ‘how-to’ videos to help get you started with using Australian Sheep Breeding Values (ASBVs).
Module 2 – Using breeding values to select for traits
Episode 1: Reproduction traits
Episode 2: Weight traits
Episode 3: Carcase and eating quality traits
Episode 4: Health and welfare traits
Episode 5: Wool traits
Episode 6: Wool visual traits
This video discusses how genomic evaluation has been a game changer for the genetic evaluation of livestock.
Understand the impact of genetics and what is passed to the next generation from the parents, as opposed to the impact of their environment.
Russell and Ricky Luhrs run a commercial prime lamb and Merino operation across three properties in western Victoria. Watch Ricky and Russell’s story about how using ASBVs has accelerated the performance of their flock.
Phillip runs a commercial prime lamb enterprise in south-western Victoria. Watch Philip’s story about how using ASBVs has accelerated the performance of his Maternal flock.
Nick and his wife Pen run a Merino and first-cross flock at Hovells Creek, NSW, where they are set on producing sheep that consistently perform in their production zone and to meet their breeding objective.
READ
AWI’s genetics R&D is focused on better understanding and Improving lifetime productivity from Merino sheep and improved sustainability and productivity whilst meeting consumer expectations.
MLA’s investment in livestock genetics R&D aims to improve the rate of genetic progress in the beef cattle and sheep industries to permanently improve on-farm productivity and animal health and contribute towards meeting consumer demands.
A clear look at how better breeding values can help you accelerate your flock’s productivity.
Sheep Genetics is the genetic evaluation service of the Australian sheep industry. Sheep Genetics help you breed or buy animals using Australian Sheep Breeding Values (ASBVs) through LAMBPLAN and MERINOSELECT and produce tools and information to help you breed better animals.
Results of comparison based on wether trial and sire evaluation results from 2007 – 2018 for benchmarks on wool cut, quality, and performance.
Annual publication reporting the results of sires across all Merino Sire Evaluation sites. Sire results published in Merino Superior Sires include Top 50 sire rankings for the four main Indexes, Australian Sheep Breeding Values (ASBVs) for wool, carcase and breech traits, plus visual classing results.
Indexes help you select animals for use within a breeding program when there are many traits of importance.
USE
Instructional video to demonstrate searching on the website.
A free service which generates within-group indexes utilising MERINOSELECT ASBVs to enhance breeding decisions, based on a producer’s individual breeding objective.
ATTEND
A one-day workshop to increase skills and awareness in breeding for flystrike resistance.
A practical, one-day workshop highlighting the key production benefits of superior genetics, plus feed management for improved reproductive performance and livestock productivity.
This training package is designed to help you prepare carefully, choose wisely and care for this profit-maker once you get him home, providing a guide of what to do before, at and after the sale.
This module provides a brief overview of the requirements and processes involved in getting started with Sheep Genetics. Gain an understanding of key requirements of the genetic evaluation and use the learning to collect trait data of interest relevant to your breeding objective.
This learning package will take you through the key things to know before using MateSel, a program which aids in balancing genetic gain and genetic diversity by optimising mate selections for given male and female candidates.