Chapter 5.2 Prepare an inventory of your farm’s natural assets
Chapter 5.2 Prepare an inventory of your farm’s natural assets
Background information
To make the best use of this procedure, it is important that you have a good ‘picture’ of the amount, condition and location of the natural assets, weeds and pests that that you need to manage in your grazing enterprise. Remember that these resources include:
- Soil: healthy productive soils, as well as gullies, eroded areas and paddocks which require careful management to improve or maintain condition (e.g., soils that are strongly acid, saline or water repellent)
- Water: the amount, pattern and ability to capture and better utilise your annual rainfall (stock water supplies are included here)
- Vegetation: weeds, native and sown pastures (and their condition), shelter belts, and remnant woody vegetation
- Riparian land: any land that adjoins a permanent or temporary body of water, be it a river, stream, wetland or farm dam
- Native and feral animals: the species present and their havens.
At a glance
- Identify and assess the condition of and threats to your farm’s natural assets and pests.
- Include all aspects of your on-farm natural resources.
Farm sustainability
Use a self-assessment tool (SAT) to audit your farm’s financial, social and environmental sustainability.
Tool 5.12 lists a number of SATs which are general enough for any sheep producer to use.
Identify and assess soil erosion risks
Use tool 6.1 in MMFS Module 6 Healthy Soils to assess and record the land classes across your farm. From your knowledge of the farm and the land classes, identify the key areas at risk of soil erosion and record them on your aerial photo.
Three forms of soil erosion are reasonably common on sheep properties:
- Sheetwash (sometimes called rill or hillslope) erosion is the movement of soil downslope by running water. The key factors are rainfall intensity, groundcover, slope length, gradient and soil erodibility
- Wind erosion is most common in drier areas. Typically, areas subject to wind erosion are exposed dry soils that lack groundcover as a result of overgrazing or cultivation.
- Gully erosion is most common in higher rainfall zones. Occurs from intense rainfall and concentrated runoff from steep ground flowing into cleared drainage lines which have unstable soils, such as sodic dispersible subsoils. Gullies produce poor quality run-off and, with streambank erosion, are the main sediment sources across southern Australia.
Maintaining and/or increasing groundcover can prevent and/or reduce the impact of these erosion processes. Set goals for groundcover in each land class on your farm using the benchmarks in chapter 6.2 in MMFS Module 6 Healthy Soils.
Use tool 6.2 and tool 6.3 in MMFS Module 6 Healthy Soils to measure groundcover at the sites with highest erosion risk on your property.
Assess the salinity risk
The primary cause of dryland salinity in Australia has been the replacement of deep rooted/perennial native vegetation with shallow rooted/annual crops and pastures that use less water. A 1,000 ha farm receiving 500 mm of rainfall has 5,000 megalitres of water to manage each year.
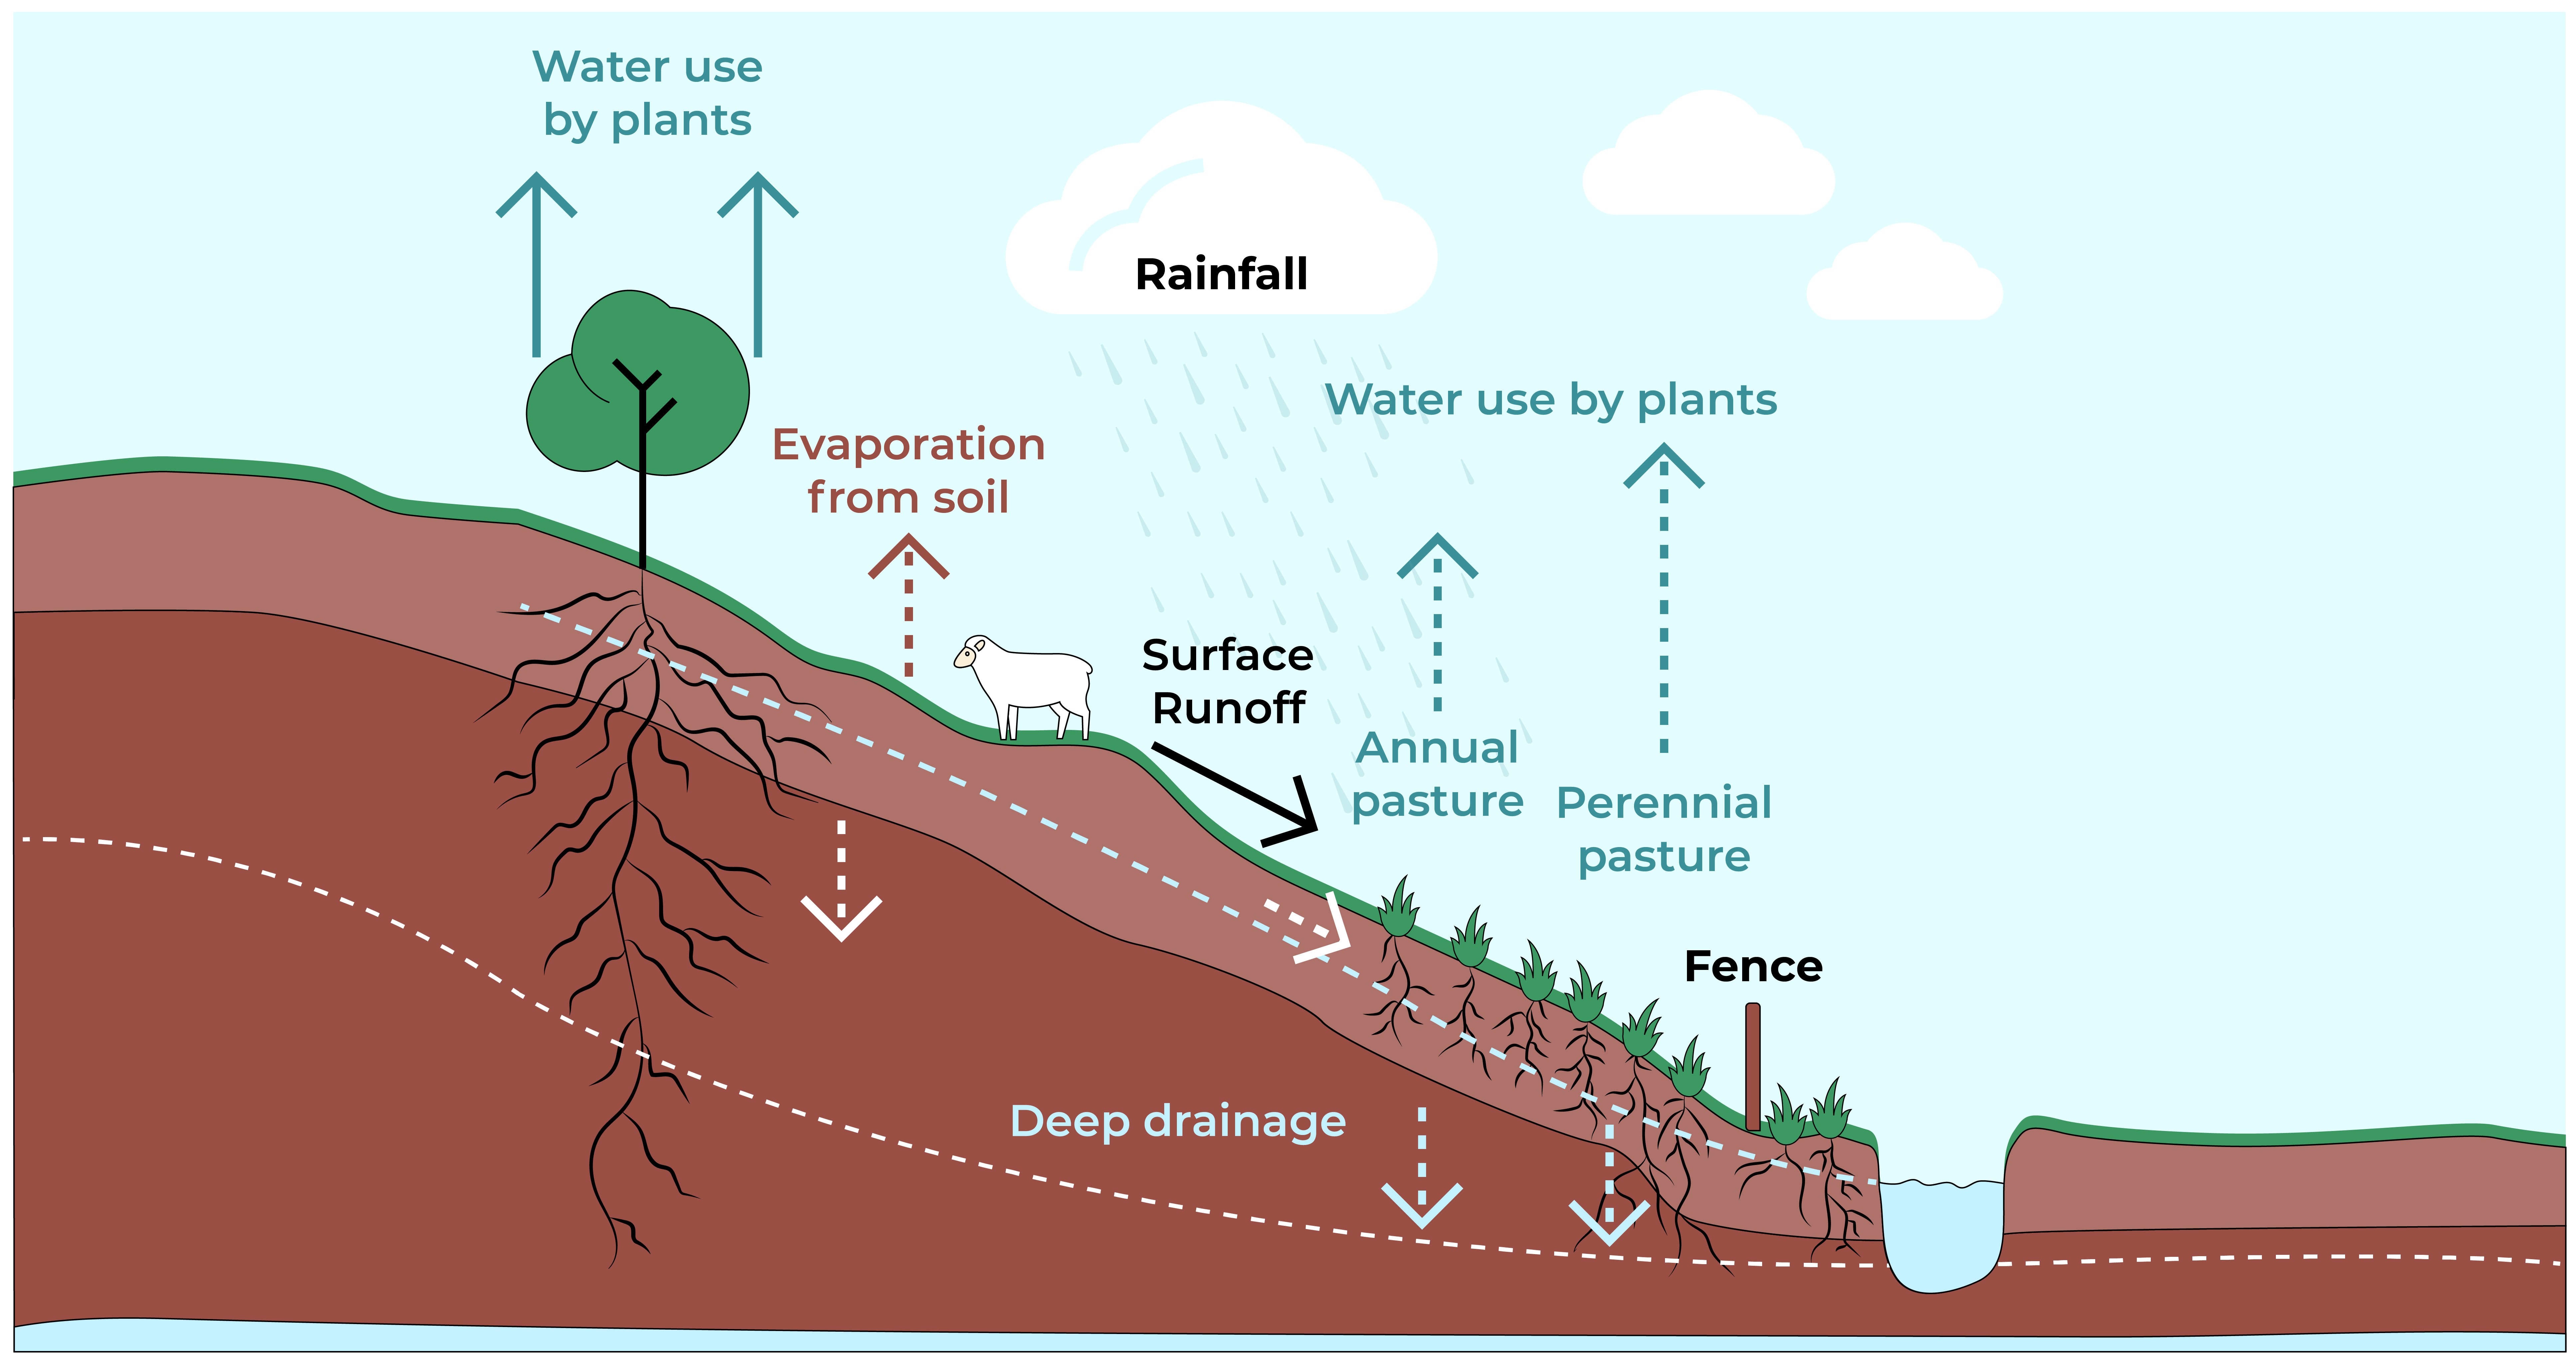
Poor management of the water cycle directly impacts on many of our resource management issues, including soil erosion, high nutrient loads in rivers, soil acidity and dryland salinity.
The excess water (often called recharge) not used by plants drains below the root zone causing the water table to rise. It may bring saline groundwater up towards, and eventually into, the root zone, somewhere ‘downslope’ (often called discharge). Sufficient salt in the root zone can restrict or stop plant growth. Contact your regional NRM agency (see signposts) to determine the risk of salinity in your area. Use the following tools to assess that risk to your grazing enterprise:
- The pasture assessment techniques in tool 7.6 in MMFS Module 7 Grow More Pasture to measure the perenniality of your pastures. Compare your result with the benchmarks in tool 7.5.
- If areas are salt-affected, tool 5.1 will help rate salinity across your paddocks. Salinity resources (see tool 5.11) will help you identify the indicator species listed in tool 5.1.
Having mainly annual plants means less water use and more potential deep drainage which contributes to rising groundwater tables. However, some deep drainage is needed to supply water to streams and wetlands.
Acidification of soil can also be greater under annual pastures because with their shorter life spans, nitrate leaching can occur, leaving behind hydrogen ions, especially at the season break when roots systems aren’t fully developed. Perennial pastures can assist in preventing soils becoming more acid.
Productive pastures, profitable grazing systems and improved sustainability are all about efficient management of the water cycle.
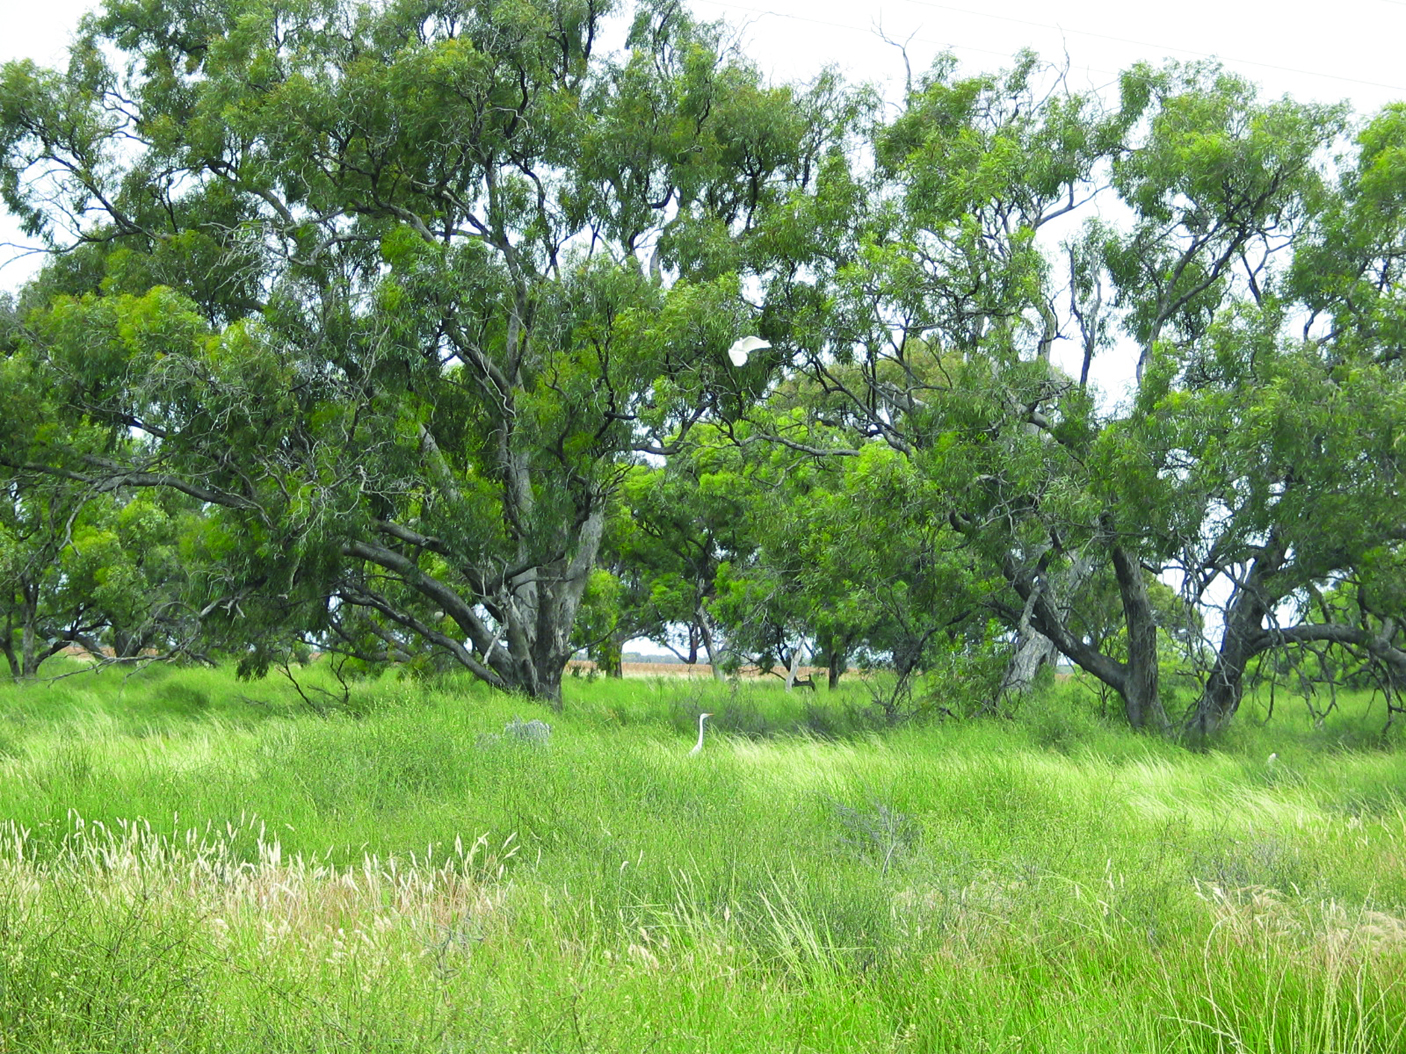
Assess the condition of native vegetation
It is important to identify what native species are present on your property to inform future management actions. Native pastures provide reliable (because of their diversity) and low input production while helping to maintain healthy soils and ecosystems. Much of Australia’s fine wool comes from native pastures because they provide a persistent, consistent feed supply.
Native grasses are more persistent when allowed to recover after grazing, so rotational grazing/resting for at least part of the year is an advantage.
Native pastures respond positively to low rates of fertiliser, but higher rates destabilise the pasture, allowing annuals and weeds to crowd out native perennials, though this can be partly mitigated by grazing management.
Species identification tools are not included in this package but tool 5.11 contains many useful references and links. Most regional NRM authorities (see signposts) have tools, access to local experts and information to help sheep producers identify native species.
Several assessment and monitoring tools are listed in tool 5.12. Use one of these tools to quickly and simply assess the condition of native bush, riparian zones and native pastures on your farm and for ongoing monitoring.
Discuss and record what you would like to see in your areas of native bush, riparian vegetation and native pastures, what changes could be made to protect areas at risk (e.g., make them larger, denser, more diverse, etc.), and when you will address these risks.
Survey birds as ‘focal’ species
- Birds have received more attention than any other animal group when designing landscapes for environmental outcomes. Birds are a popular choice for several reasons:
- Birds are mobile – they move across the landscape at the planning scale of hectares (paddocks) and kilometres (properties).
- Birds are relatively easy to survey, being abundant and visible during the day.
- Birds are placed well towards the top of food chains – an ibis can eat 250 grasshoppers/day and a magpie can eat 40 scarab beetle larvae/day.
A diverse range of bird species inhabiting the ground, the understorey layers and mature trees indicates the remnant vegetation is healthy.
Native birds are perhaps the most useful ‘indicator’ group. A farm with a rich diversity of birds will also have a relatively high diversity of trees, shrubs, mammals, reptiles, frogs and invertebrates. If the small birds are missing, there is something wrong with the habitat. Too many larger birds or noisy miners indicate a lack of balance.
Use Quickchecks (see signposts) to assess bird numbers and diversity on your property. The tool accounts for the fact that different parts of the farm will have different bird groups, highlighting the fact that a variety of habitats is required across the farm.
Alternatively, keep a small notebook in the ute or make a list on your phone and record birds (and/or native animals) as you come across them in your ordinary day’s work. All family members can record what they see and where and later add them to a master list.
Identify changes you can make to the vegetation on your farm to improve bird populations, and when you will make them.
Assess the prevalence of weeds
Pests and weeds threaten both pasture productivity and natural resources. The threat posed to biodiversity by weeds is ranked second only after land clearing.
Successful weed management is much more than ad hoc weed control. It is important to work out why weeds are a problem on your property; set realistic goals for both pasture and weed management; undertake the appropriate weed management practices on time, every time; check whether your weed management has been successful; and adapt your plan as needed. Weeds can spread from adjoining properties, so you may need to involve your neighbours to get the best results.
This approach of Deliberation, Diversity and Diligence is called the ‘3Ds of Weed Management’. Each step has key decisions and critical actions. Use the Deliberation table in tool 5.3 to compare a stocktake of your current weed problems (species and density in key paddocks) and agree on priorities for action based on what you want the weed level to be. Record what changes could be made to weed populations on your farm by when.
Assess invertebrate pests
Invertebrate pests, including insects and mites, can significantly reduce pasture productivity throughout the year.
Across Australia, redlegged earth mite (RLEM) infest 20 million hectares of pasture, causing $200 million damage to the wool industry alone.
The first step on the farm is to correctly identify the pest. Your local agronomist can help you identify the species present. Other sources of information include CSIRO Entomology (see tool 5.11), state departments of primary industries and Cesar Australia.
Identify what you would like the pest level to be, and what changes could be made to reduce and keep pest populations small.
It is important to choose the appropriate tools to manage each pest, using multiple approaches and not just insecticides (integrated pest management or IPM – see chapter 5.3) and to monitor the effectiveness of your approach.
Different pests require different management strategies. For example, RLEM and blue oat mite (BOM) look very similar but have different lifecycles. This difference means that the timing of pesticide spraying using TIMERITE® (see signposts in chapter 5.3) works for RLEM, but not for BOM.
Assess vertebrate pests
A variety of vertebrate pests affect sheep farms across Australia, including introduced pests such as goats, deer, rabbits, pigs, foxes and wild dogs. Native browsers such as kangaroos, wallabies and wombats can also sometimes cause issues for livestock & cropping production systems.
Many of the habitats that support native animals and birds on farm also favour the vertebrate pests. Producers have to find the balance that suits their situation.
Rabbits damage vegetation by ringbarking trees and shrubs; prevent regeneration by eating seeds and seedlings; and degrade the land through burrowing and reducing groundcover leading to erosion. Selective grazing by rabbits changes the composition of the vegetation.
Where rabbits have caused the slow decline of, say, bulokes on roadsides in western Victoria, there are fewer food trees for species such as the red-tailed black cockatoo that have declined as a result, though clearly not from ‘direct competition’ from the rabbits.
The impact of rabbits often increases during and immediately after drought or fire, when food is scarce and they eat whatever remains or re-grows. 2–3 rabbits/ha is sufficient to severely depress the regeneration of native shrubs and trees.
Spotlight transect counts (the number of rabbits seen along a set route or transect) are an accurate way to monitor rabbit populations, though the number of rabbits seen in the car headlights when driving home provides a good enough indicator of rising or falling rabbit numbers.
Foxes are significant predators of native wildlife. While they are also known to prey heavily on European rabbits at certain times of the year, evidence suggests red foxes are a primary cause in the decline and extinction of many small- and medium-sized rodent and marsupial species in Australia. They also prey on many bird species. While foxes are known to scavenge and remove dead or mismothered lambs, fox predation has also been identified as the primary cause of death in studies conducted across the country. Predation rates vary between production settings and landscapes however the average rate of primary predation on lambs varies between 5–10% but can be as high as 22% in some circumstances.
The average density for foxes in Australia in most landscapes is around four per square kilometre but estimates as high as seven per kilometre have been recorded in from areas, for example around Orange in New South Wales. Fox territories range from 2–5 km2 so you might have numbers of 8–20 foxes. Foxes are highly mobile and will continue to migrate and establish new territories after the breeding season so monitoring fox populations in the lead up to lambing is essential, however managing foxes throughout the year will be beneficial for native fauna and biodiversity. Delivery of fox management programs in conjunction with rabbit control is also beneficial for production and biodiversity protection so that foxes don’t focus their predation pressure on to lambs and native animals once the rabbit populations have been reduced through annual biological control outbreaks or management activities.
Feral pigs are distributed across many of the sheep regions across Australia and continue to spread into new areas, both naturally and through illegal dumping. They cause agricultural damage by preying on newborn lambs, reducing crop yields, damaging fences and water sources, and competing with stock for feed by consuming or damaging pasture, and cause extensive damage to natural habitats by turning over vast areas of soil when rooting for food. They also wallow and foul up water sources, trample and consume native vegetation, and facilitate the spread of weeds and Phytophthora (a plant pathogen causing dieback in native plants and trees). Feral pigs also host serious diseases with the potential to devastate livestock operations including foot and mouth disease (FMD).
Identify the prevalence of vertebrate pests and their location on your farm, what you would like the pest level to be and what changes could be made to reduce and keep numbers down.
Audit stock water supplies
The majority of Australia’s livestock drink from water that falls on the property but can come from a variety of sources including rivers, creeks and channels, dams, ground tanks, wells or bores. Whatever the source, the suitability of water you have now and the water you need for the future depends on its quantity, quality and reliability.
A variety of measures can improve water use efficiency in sheep grazing systems, including creating additional watering points, using troughs to improve water quality and reduce evaporation and maintaining healthy soils to minimise run off.
Healthy soil drives higher pasture productivity and benefits the environment through greater use of water and nutrients in the paddock and less risk of run-off, erosion and deep drainage (see chapter 6.4 in MMFS Module 6 Healthy Soils).
Like a feed budget (see tool 8.4 in MMFS Module 8 Turn Pasture into Product), tool 5.2 will allow you to calculate your stock water requirements by understanding how much water you have, how much your stock need, and how long a dam or water supply will last.
You need to consider the following regarding your water resources:
- Source (groundwater, rain fed)
- Quantity
- Quality
- Reliability and amount of ongoing monitoring required
- Water requirements of livestock – daily and maximum
- Location and proximity to other sources
- Costs (time and labour) associated with providing it to stock
- Impacts of non-domestic animals on watering points
- Condition of source and its associated infrastructure, and delivery mechanisms
- Risk assessment – consider the likelihood and consequence of various risks such as equipment failure, or blue green algal bloom, or lack of rainfall.
Use tool 5.2 to complete a stock water audit of the quantity, quality and reliability of your stock water supplies.
Assess farm carbon footprint
The Earth’s surface temperature depends on the balance between incoming and outgoing radiation. The main greenhouse gases – water vapour, carbon dioxide (CO2), methane (CH4), nitrous oxide (N2O) and ozone – absorb and re-radiate much of the infrared radiation released by the Earth’s surface.
All of these gases occur naturally and are essential to producing a natural greenhouse effect, maintaining the temperature of the Earth’s surface some 33°C warmer than it would otherwise be and making Earth inhabitable. Together, they make up less than 1% of the atmosphere, which is comprised mainly of nitrogen and oxygen.
When looking at global greenhouse gas (GHG) emissions, carbon dioxide contributes the largest proportion, while methane and nitrous oxide make up a smaller part. Australia’s GHG emissions are shown in figure 5.2, which includes emission estimates for multiple sectors (National GHG Inventory Total, Energy, Fuel Combustion, Transport, Fugitive Emissions from Fuels, Industrial Processes, Agriculture, Land Use, Land-Use Change and Forestry KP, Waste, and Other).
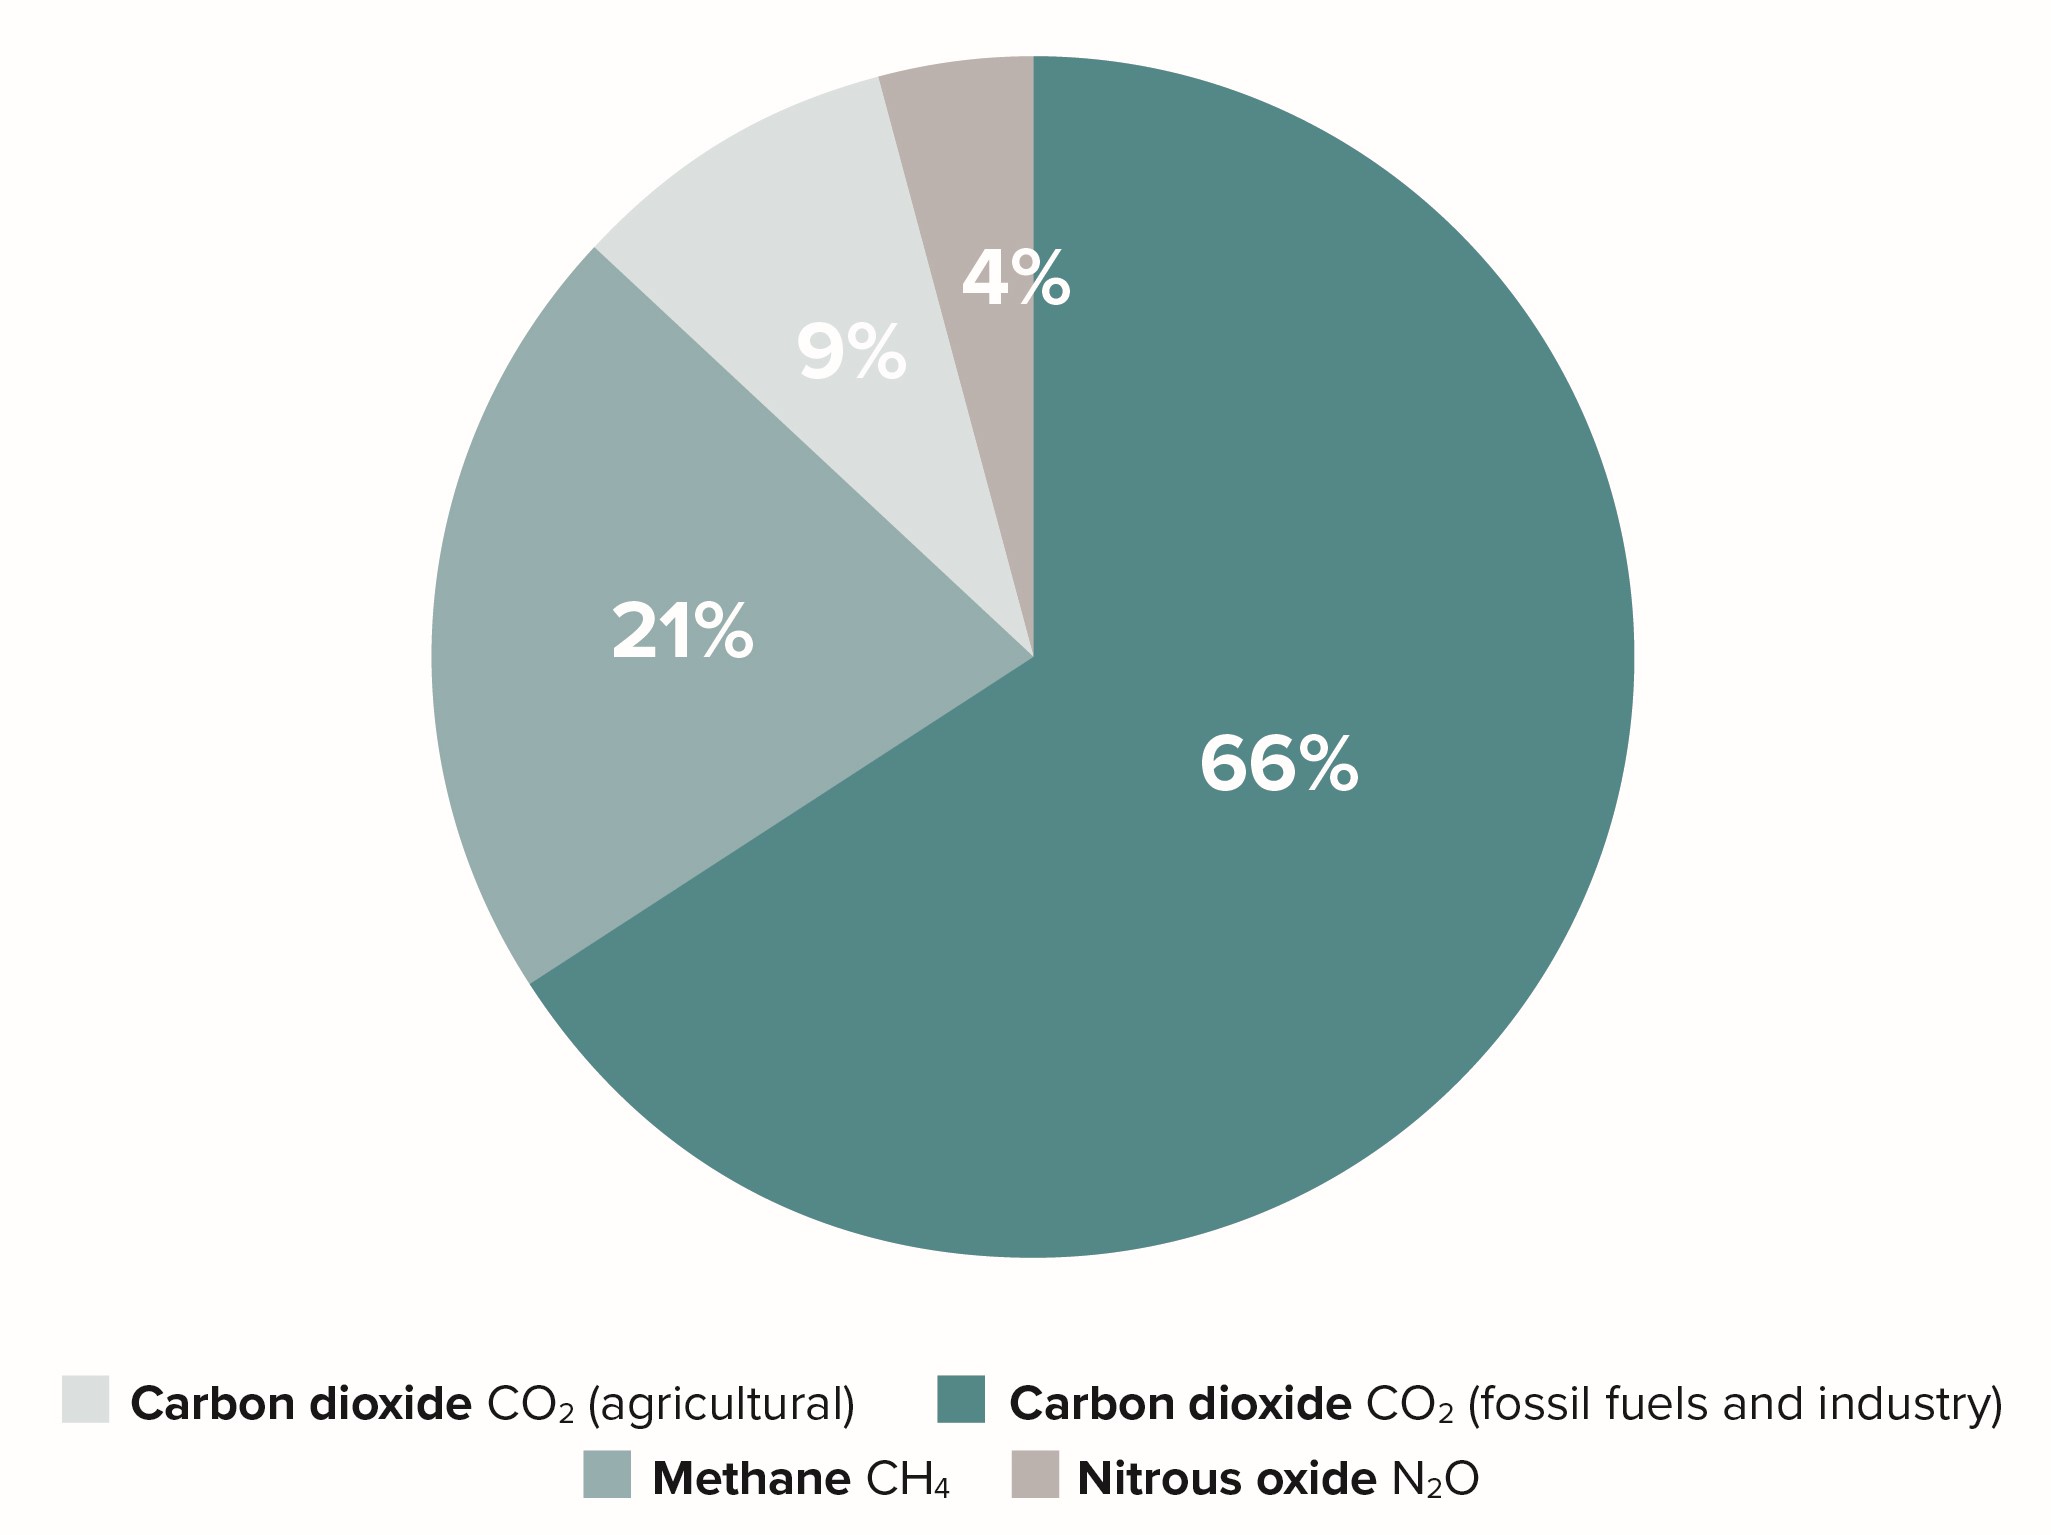
The main emissions from agricultural production are CO2, CH4 and N2O (figure 5.3). GHG emissions are measured in carbon dioxide equivalents (CO2e) to allow for comparison in terms of the quantity and potency of emission sources, as each gas has a different capacity to contribute to global warming. For example, methane (the largest source of livestock emissions) is a more potent GHG than carbon dioxide. Between 1750 and 2019, global methane concentrations rose by 150% and nitrous oxide by 22% (CSIRO global methane and nitrous oxide trackers).
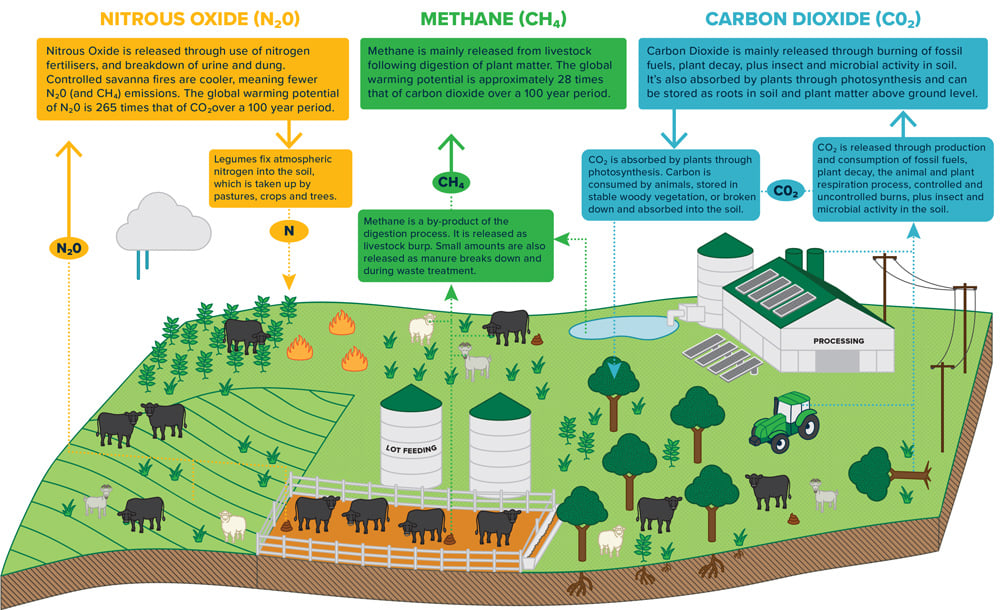
Australia’s livestock industry (including dairy) produces 10% of Australia’s total GHG emissions (compared, for example, with energy sector generation which represents 37% of Australia’s GHG emissions). Most of the emissions from Australia’s livestock industry are methane (56%). Methane is emitted during the production and transport of coal, natural gas, and oil, and by the decay of organic waste (e.g. municipal solid waste landfills). Enteric (occurring in the intestines) methane arises from ruminant digestion and manure management. Nitrous oxide emissions arise predominantly from manure excretion and fertiliser application. Carbon dioxide emissions arise from fossil fuels used for lime and urea inputs, transport, machinery and other uses on-farm, and can also arise from the manufacture of purchased inputs such as fertiliser and feed. Carbon dioxide emissions or removals (storage) can also occur from changes in soil and vegetation carbon levels.
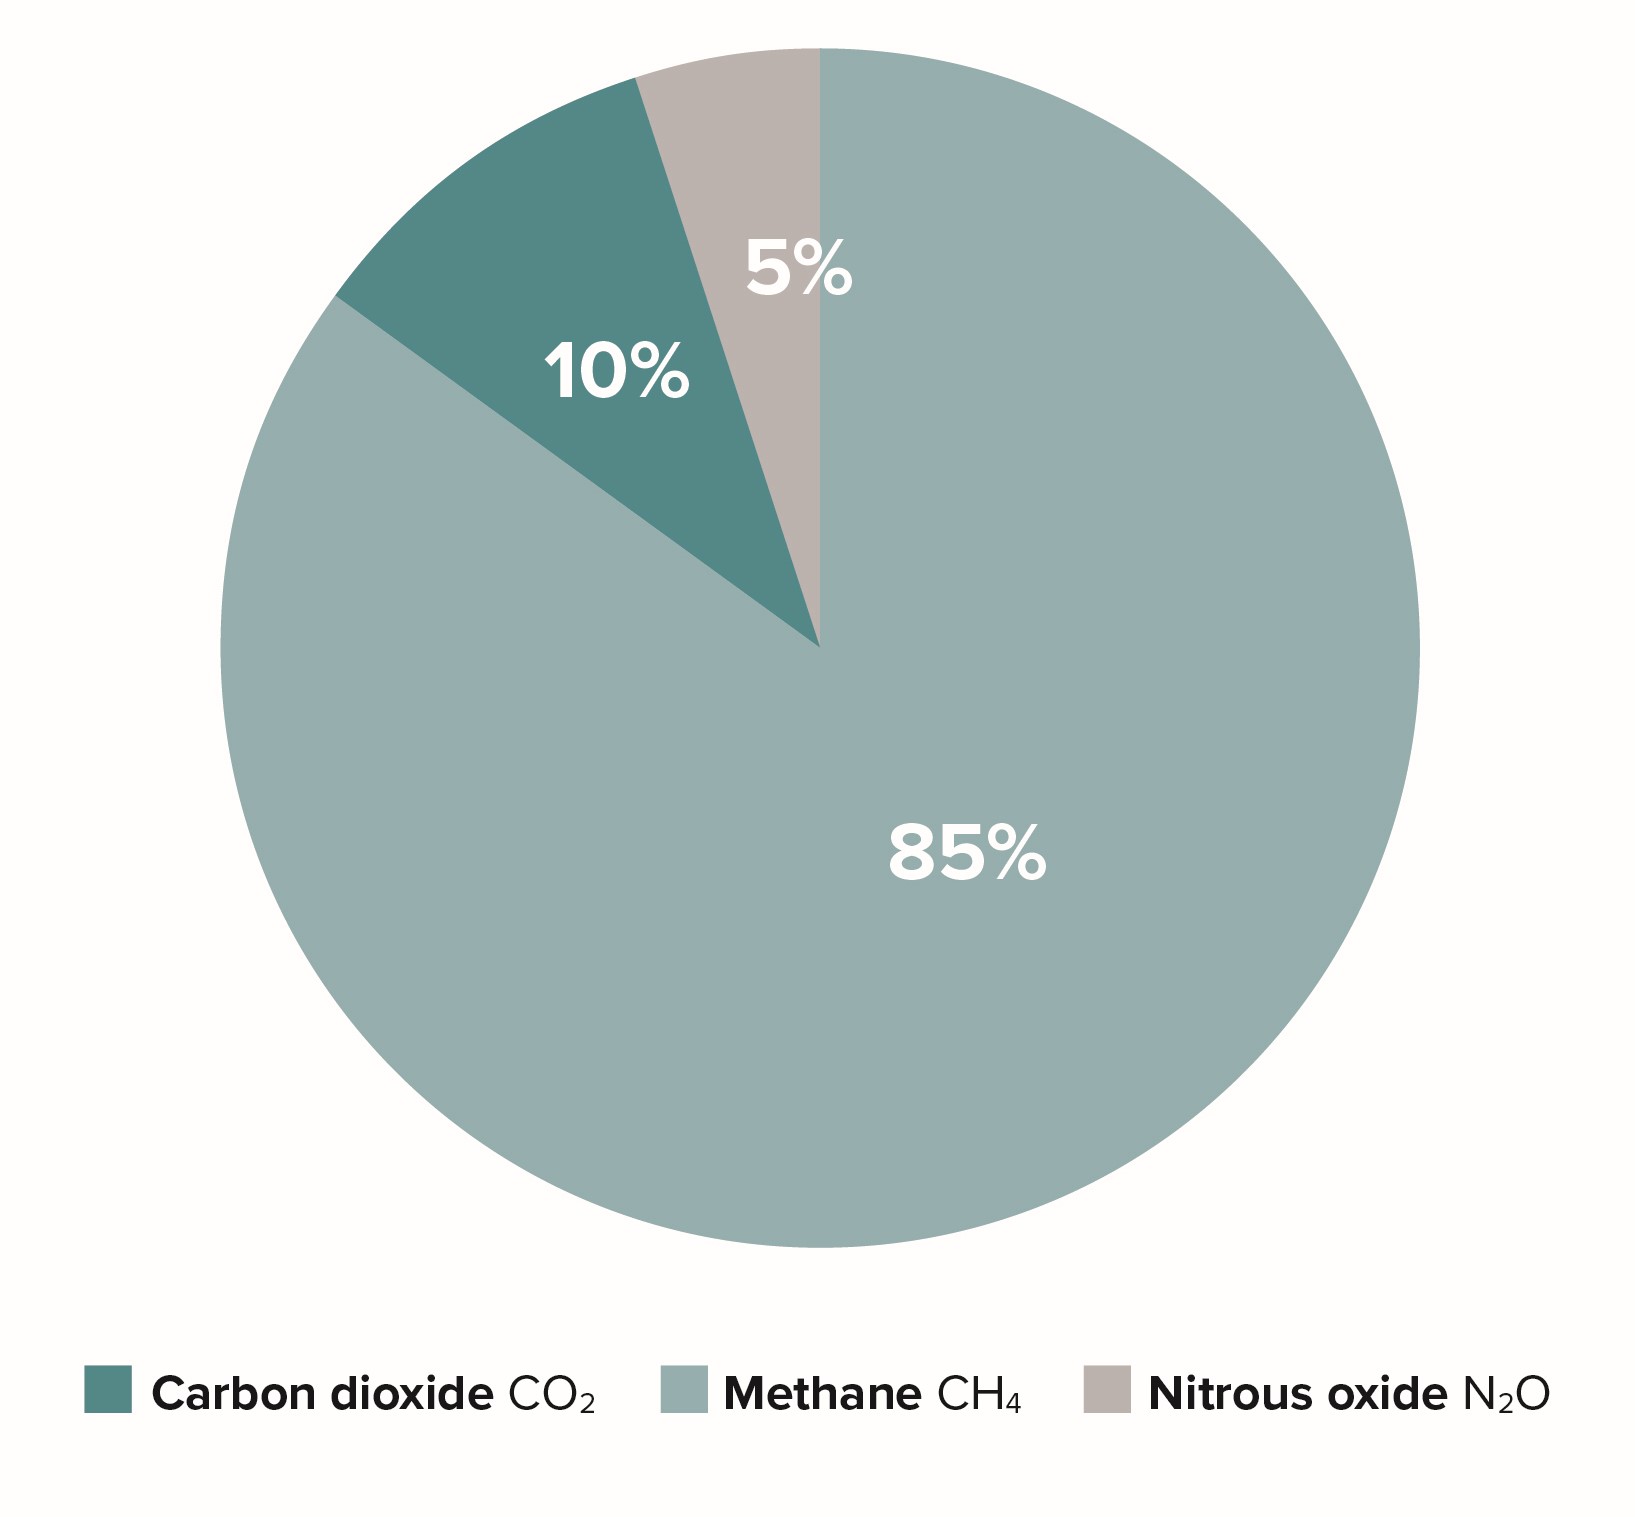
Typical GHG emissions in Australian beef and sheep systems have been estimated to emit around 85% of their GHG as methane (figure 4.5).
Methane emissions as a result of ruminant digestion and is released into the atmosphere via belching. It represents a major energy loss for the animal, as methane has an energy content of 55.65 MJ per kilogram (much the same as that of natural gas).
In grazing ruminants, energy losses from methane are in the order of 6–10% of gross energy intake. Assuming a pasture with metabolisable energy (ME) of 7. 3–11.7 MJ/kg DM, this loss equates to between 10–16% of ME.
Reducing these emissions would substantially increase the amount of energy available for growth and reproduction. For this reason, it could be a major productivity gain if solutions or improvements were found for methane production.
Methane production per animal has a linear relationship to dry matter intake (DMI) (Charmley et al., 2016). This is true for most pasture types, but a small number of specific feed types have been shown to produce less methane per kilogram of DMI. When assessing emissions for a herd or flock, the key determinants that influence the level of these emissions are:
- livestock numbers
- livestock seasonal weights and mature weights
- growth rates and reproductive status (the factors that influence feed intake).
The importance of this issue is progressing at a rate faster than policy can be developed. Some graziers are keen to investigate what can be done on farm to reduce their carbon footprint. Whether this is to investigate potential carbon trading, offsets, insets, marketing opportunities or personal goals, calculation of farm emissions is a good place to start working out how emissions might be reduced and more carbon stored on farm.
Use an emissions calculator (see signposts) to estimate your farm’s annual GHG emissions (both at the individual enterprise activity level and for your farm as a whole) and to examine the financial impacts that different GHG mitigation options may have on farm business profitability.
A life cycle assessment of sheep meat and wool production in south-eastern Australian production systems measured emissions intensity of 6.8 kg CO2e per kilogram of liveweight and 26.8 kg per kilogram of greasy wool.
Assess how climate change impacts on your farm
Australian sheep producers have always dealt with a variable climate and its associated droughts and floods. Climate change scenarios suggest this variability will increase.
In the sheep industry, climate change is likely to impact on:
- pasture and fodder crops – production could increase under higher carbon dioxide concentrations; however, this increase may be offset by lower nutrient content, higher temperatures, and lower rainfall.
- water resources – water supplies will decline in some areas because of increased evaporation, reduced runoff into storages, and decreased and more variable rainfall.
- wool production and quality – reduced wool production and quality in some marginal areas where pasture growth is reduced but there might be increased productivity in areas of high rainfall.
- animal health and reproduction – increased heat and water stress and possibly changes in the spectrum of pests and diseases that affect sheep. Indications of effects of heat stress on reproduction include reduced conception rates during periods of prolonged heat during joining.
- land stewardship – increased pressure from the community for agriculture to reduce the impacts of climate change.
- competition from other agricultural activities – increased competition from other agricultural industries (particularly for cropping).
- national and international markets – for example in New Zealand and China, sheep producers are likely to be advantaged as warmer and wetter regional conditions extend their grazing zones.
- product contamination and discounting – vegetable matter and dust contamination in wool and grass seed contamination in carcases could increase where pasture composition changes, particularly if weeds and bare ground increase.
Sheep producers now face not only the continued challenge of managing production of food and fibre, given the variability in climatic conditions, but the new challenges created by the community’s desire to see reductions in carbon emissions.
To view predictions for changes in seasonal rainfall, temperature, wind speed and solar radiation under future GHG emissions scenarios (known as ‘Representative Concentration Pathways changes’, where RCP4.5 is low emissions and RCP8.5 is the highest emissions pathway) for your state and region, visit Climate Change in Australia State Climate Statements.
SIGNPOSTS
WATCH & LISTEN
Grower case studies, technical information, control methods and interviews with researchers and field officers on all things pest management.
Melbourne University Professor Richard Eckard, Director of the Primary Industries Climate Challenges Centre, explores how grazing industries including wool, dairy and beef are adapting to climate change. Climate challenges facing the grazing industries.
Best practice predator management webinar from BestWool/BestLamb.
Read
A variety of resources which explain how grazing management techniques can be used to achieve these productivity and emissions benefits.
The AWI website has information and case studies relevant to sheep producers on a range of natural resource management issues, including soil, water, biodiversity and regenerative agriculture.
A project commissioned by MLA to investigate if the Australian red meat industry could become carbon neutral by 2030 (CN30), and if so, how.
For access to all regional natural resource management NRM authorities across Australia go to the website and click on your region.
Provides information and guidance on best-practice invasive animal management on several key vertebrate pest species including rabbits, wild dogs, foxes and feral pigs. Information is provided as fact sheets, case studies, technical manuals and research reports.
Fact sheets and tools from MLA for biodiversity assessment and management.
The Australian red meat industry has set the ambitious target to be carbon neutral by 2030 (CN30).
The CN30 Roadmap describes what a carbon neutral Australian red meat industry means, why industry has set the target, the work areas industry will focus on between now and 2030, and how the industry can execute those work areas.
CSIRO and BoM national climate projections, information, tools, data, and learning resources for those wishing to make use of climate projections.
DPIRD has mapped areas above 600 mm average annual rainfall that are at risk of salinity for potential areas for tree planting proposals for carbon sequestration.
Understanding carbon emissions, climate and weather by Agriculture Victoria.
Tips for developing a carbon neutral brand as customers and consumers are driving a trend towards carbon neutral and low carbon brands as they seek the companies from which they purchase to exhibit strong environmental stewardship credentials.
A list of steps producers can use today or in the near future to make productivity-led emissions reductions and improvements in carbon storage on-farm.
A review and recommendation of carbon emission calculators DPIRD.
Important information about sheep production in Australia focusing primarily on animal welfare, protecting the environment and health and nutrition. Through a transparent approach, Good Meat informs consumers about the great work of Australian red meat producers and the high-quality product they produce.
Facts on the red meat and livestock industry using evidence-based information to inform the community on topics such as the environment, animal welfare, and nutrition.
Defines sustainable sheep production in Australia, prioritises industry issues and measures industry performance against relevant indicators.
Resources specific to NSW.
Resources specific to Victoria.
Resources specific to SA.
Resources specific to Queensland.
Resources specific to WA.
Resources specific to Tasmania.
Use
The Carbon Calculator is designed to help you work through completing emissions estimate for your farm. The Calculator enables the calculation of total enterprise greenhouse gas emissions as well as emissions intensity per product produced, e.g., beef, sheepmeat, wool, grain.
Provides information and guidance on best-practice invasive animal management on several key vertebrate pest species including rabbits, wild dogs, foxes and feral pigs. Information is provided as fact sheets, case studies, technical manuals and research reports.
The guide to Australian insect families by CSIRO Entomology.
Technical sheets for over 50 agricultural invertebrate pests.
Carbon accounting calculators for Australian sheep, beef, feedlot and grain farms.
Record bird sightings and manage your data, as well as providing much needed scientific data for protection of Australian birds.
Record bird sightings and manage your data, as well as providing much needed scientific data for protection of Australian birds.
A community website and app farmers, community groups, pest controllers, local government, catchment groups and individuals managing pest animals that allows you to map sightings of pest animals and record the problems they are causing in your local area.
A community website and app farmers, community groups, pest controllers, local government, catchment groups and individuals managing pest animals that allows you to map sightings of pest animals and record the problems they are causing in your local area.
Attend
A one-day workshop that gives producers a broad understanding of the environment in which they operate and the core principles behind successfully maintaining grazing land condition and long-term productivity.