Tool 7.6 Pasture assessment techniques
Pasture composition
This method can be used to assess the frequency of both individual species (e.g. phalaris) and species groupings (e.g. perennial grasses).
- Cut a 30 cm length of 1 cm-thick dowel, and drive a nail into one end
- Throw the stick ahead at random intervals while walking across the pasture
- After each throw, identify and record the pasture species or species group that is touching or immediately below the nail head at the end of the thrown stick
- Repeat 20 times (depending on the evenness of the pasture)
- Add the number of hits for each species or group and multiply by five (to convert to number of hits out of 100) to give % frequency (or composition)
- Normal groups used are perennial grasses, legumes, annual grasses, weeds and bare ground.
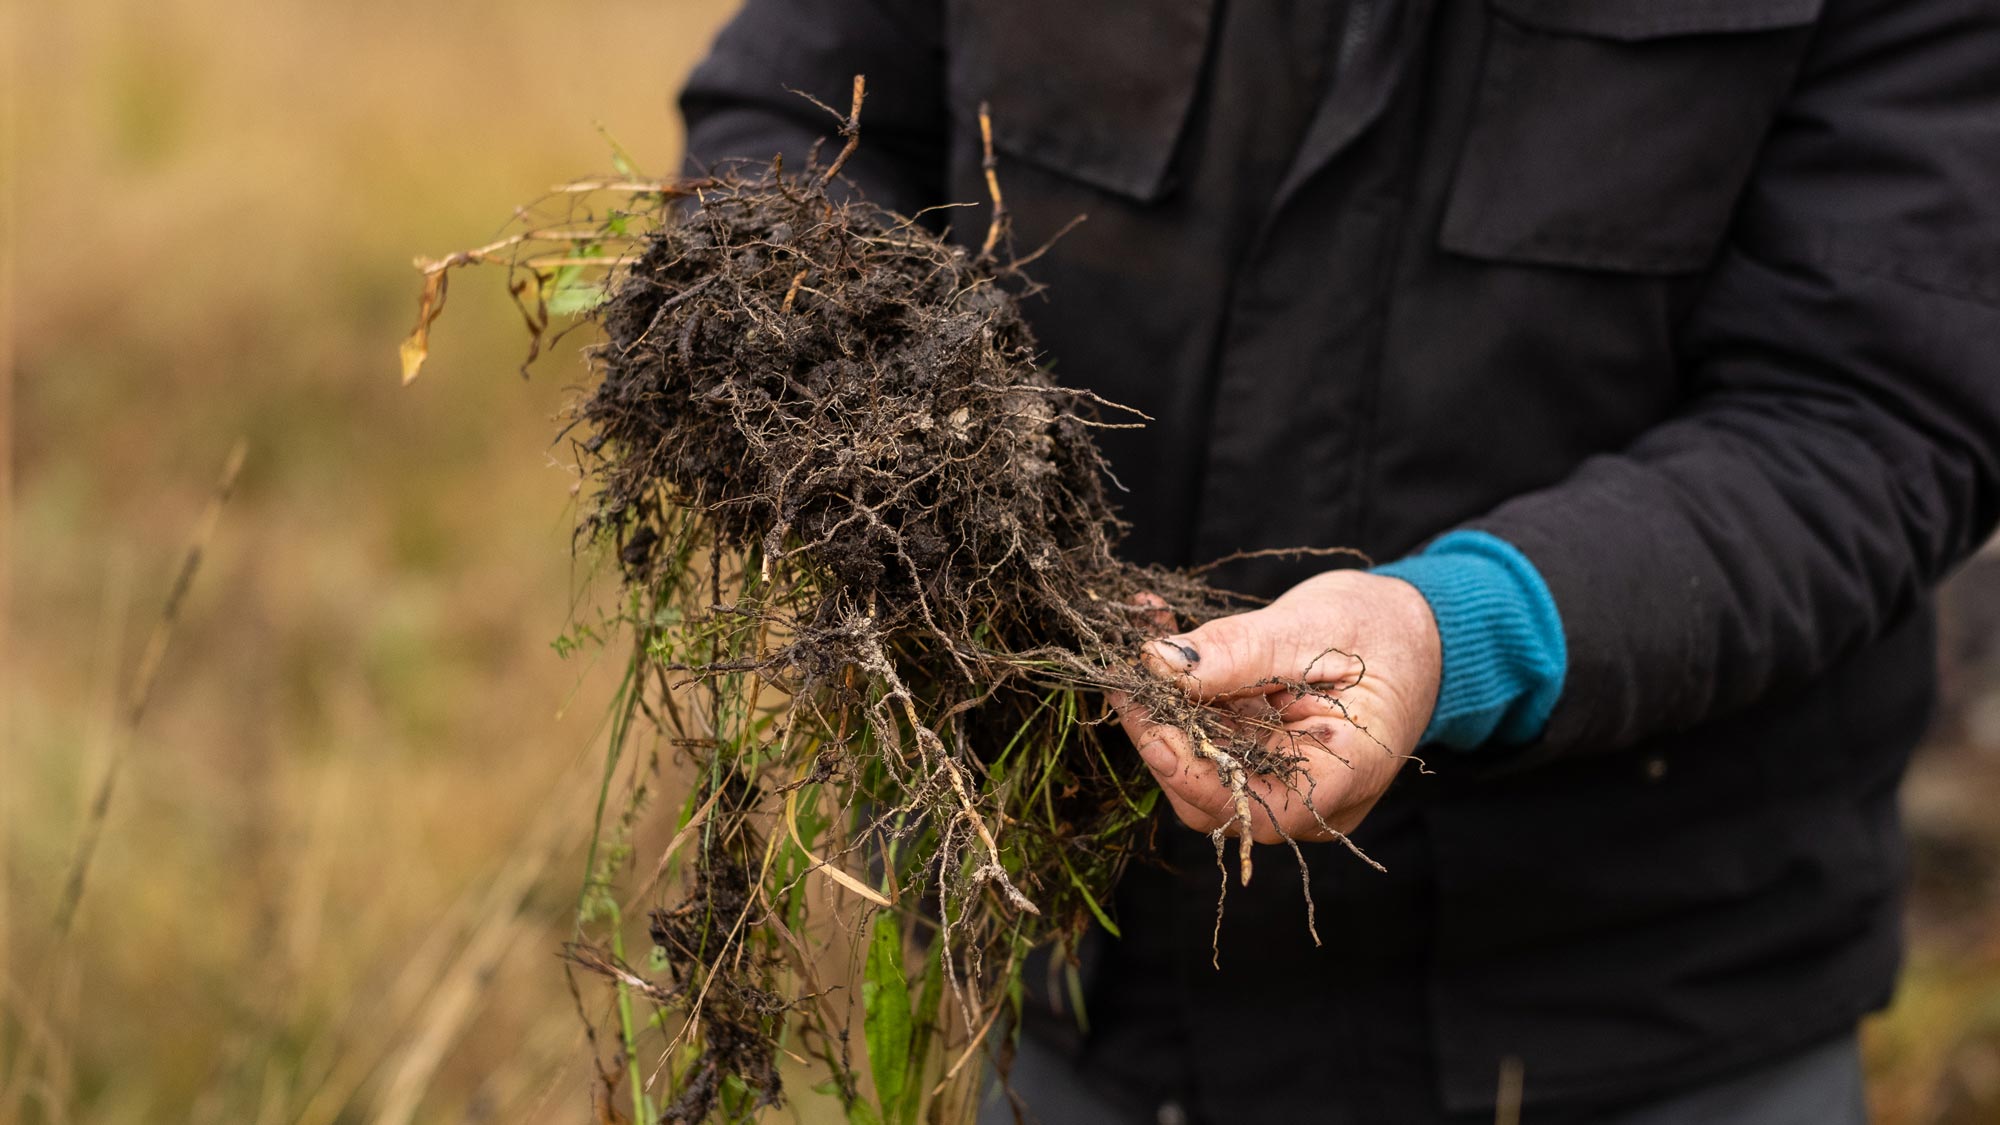
Perennial grass establishment and persistence
Counting the number of perennial grasses per square metre is a good way to assess:
- How well the grasses established
- How well the sown grasses are persisting.
To measure plants/m2, make up a quadrat (metal square) with the dimensions of 25 cm x 25 cm. The technique involves throwing the quadrat 20 times across the paddock and recording the number of perennial plants inside the quadrat. Work out the average number of plants recorded inside the quadrat. Multiply results by 16 to convert to plants/m2.
Pastures will recover with careful grazing management if you have 5-8 perennial plants/m2. Tool 7.5 will help you choose the most appropriate grazing management strategy for your pasture.
Groundcover
Groundcover includes existing pasture, weeds and other herbage as well as litter. To estimate groundcover, stand in a representative part of the pasture and drop a 25 cm x 25 cm quadrat on the ground. Look vertically into the pasture within the quadrat and estimate the percentage area covered by plant matter and litter.
Walk over the paddock and repeat the assessment at about 20 random sites. Record and average the results to determine the percentage of groundcover.
Tool 6.2 in MMFS Module 6 Healthy Soils has photos of 20%, 40%, 70% and 90% groundcover to help you estimate groundcover in your pastures.
Pasture or herbage mass and feed on offer (FOO)
Pasture mass and feed on offer (FOO) are terms used to describe how much pasture is present in a paddock and are expressed as kilograms of dry matter per hectare (kg DM/ha). Water in pasture has no nutritional value so when relating the quantity of feed or energy content of pasture or supplement to what the animal can eat and utilise, water must be ignored.
Pasture or herbage mass (used mainly in NSW) assumes 300 kg dry matter is unavailable to sheep, while a FOO measurement includes all above-ground plant material. Thus, estimates of pasture/herbage mass are lower than FOO estimates.
Pasture mass and FOO can be assessed by cutting, drying and weighing representative pasture samples. However, tools are available which save much time in collection and are considered to be the more practical method for use when day-to-day assessments are being made.
There are five types of tools available to measure pasture mass and FOO. These tools give an approximation only, and some tools (for example, tools 1 and 4 in the list below) can give variable results when used on annual pastures that are highly variable in composition, in the early establishment phase of growth, or intensively grazed clover-dominant pastures in spring.
1. MLA Pasture rulers measure green pasture height (in cm) and are simple and easy to use. To order your free MLA pasture ruler call 1800 675 717. The MLA pasture ruler is designed as a quick paddock estimate for moderately dense green pasture. With experience, you can use the height assessment method to gain reasonably accurate estimates of mass, especially when periodically checked against assessments made by cutting and weighing.
2. AWI Feed on Offer Library allows users to estimate FOO and nutritive value of grazed pastures by viewing images and nutritional tests of pastures from regions across Australia.
3. Rising plate meters measure total pasture mass (green and dry standing feed) and are based on a plate that rises up a probe depending on the amount of compressed pasture material between the plate and ground. Pasture cuts need to be taken to calibrate the meter. They are available from a number of commercial outlets, and price generally depends on the degree of automation of collection. Rising plate meters are generally cheaper than electronic probes and may be preferable when frequent automated assessment of pastures with significant levels of dry pasture is needed.
4. Electronic pasture probesmeasure dry matter of green material only. They are quick, easy to use and usually fully automated. Some also allow collection of user-defined and read assessments such as groundcover and the plant shape (flat, upright, etc.). Their accuracy declines if there is any free moisture present in the pasture, e.g., after rain or heavy dews. They are normally the most expensive of the options. Numerous commercially available meters and probes are available and most rural merchandisers can also help locate commercially available models.
6. Satellite imaging of pasture growth can be found at Australian Feedbase Monitor (AFM), which is a joint MLA and Cibo Labs initiative providing every MLA Member with free access to estimates of whole of property pasture biomass, ground cover and woody cover. This tool provides producers with an understanding of feedbase trends across their property with the added ability to look at historical estimates.
WA producers have another option in Pastures from Space web application, which shows mapping imagery and estimates of feed on offer and pasture growth rates.
Pasture leaf stage
Assessment of leaf stage is made for target species and involves the examination of individual tillers from perennial grass clumps, or annual grasses. To count the number of new leaves on each tiller, inspect at least six plants across the paddock. Don’t count the remnant leaf — this is the portion of leaf left from the last grazing and will be obvious as it will be the one with the tip eaten off. If the paddock has been evenly grazed, the assessment will be fairly straightforward. If the paddock was unevenly grazed, some plants will have more leaf material left behind after grazing.
The regrowth of leaves is closely correlated to levels of water-soluble carbohydrates stored in the tiller bases as shown in figure 7.6 below.
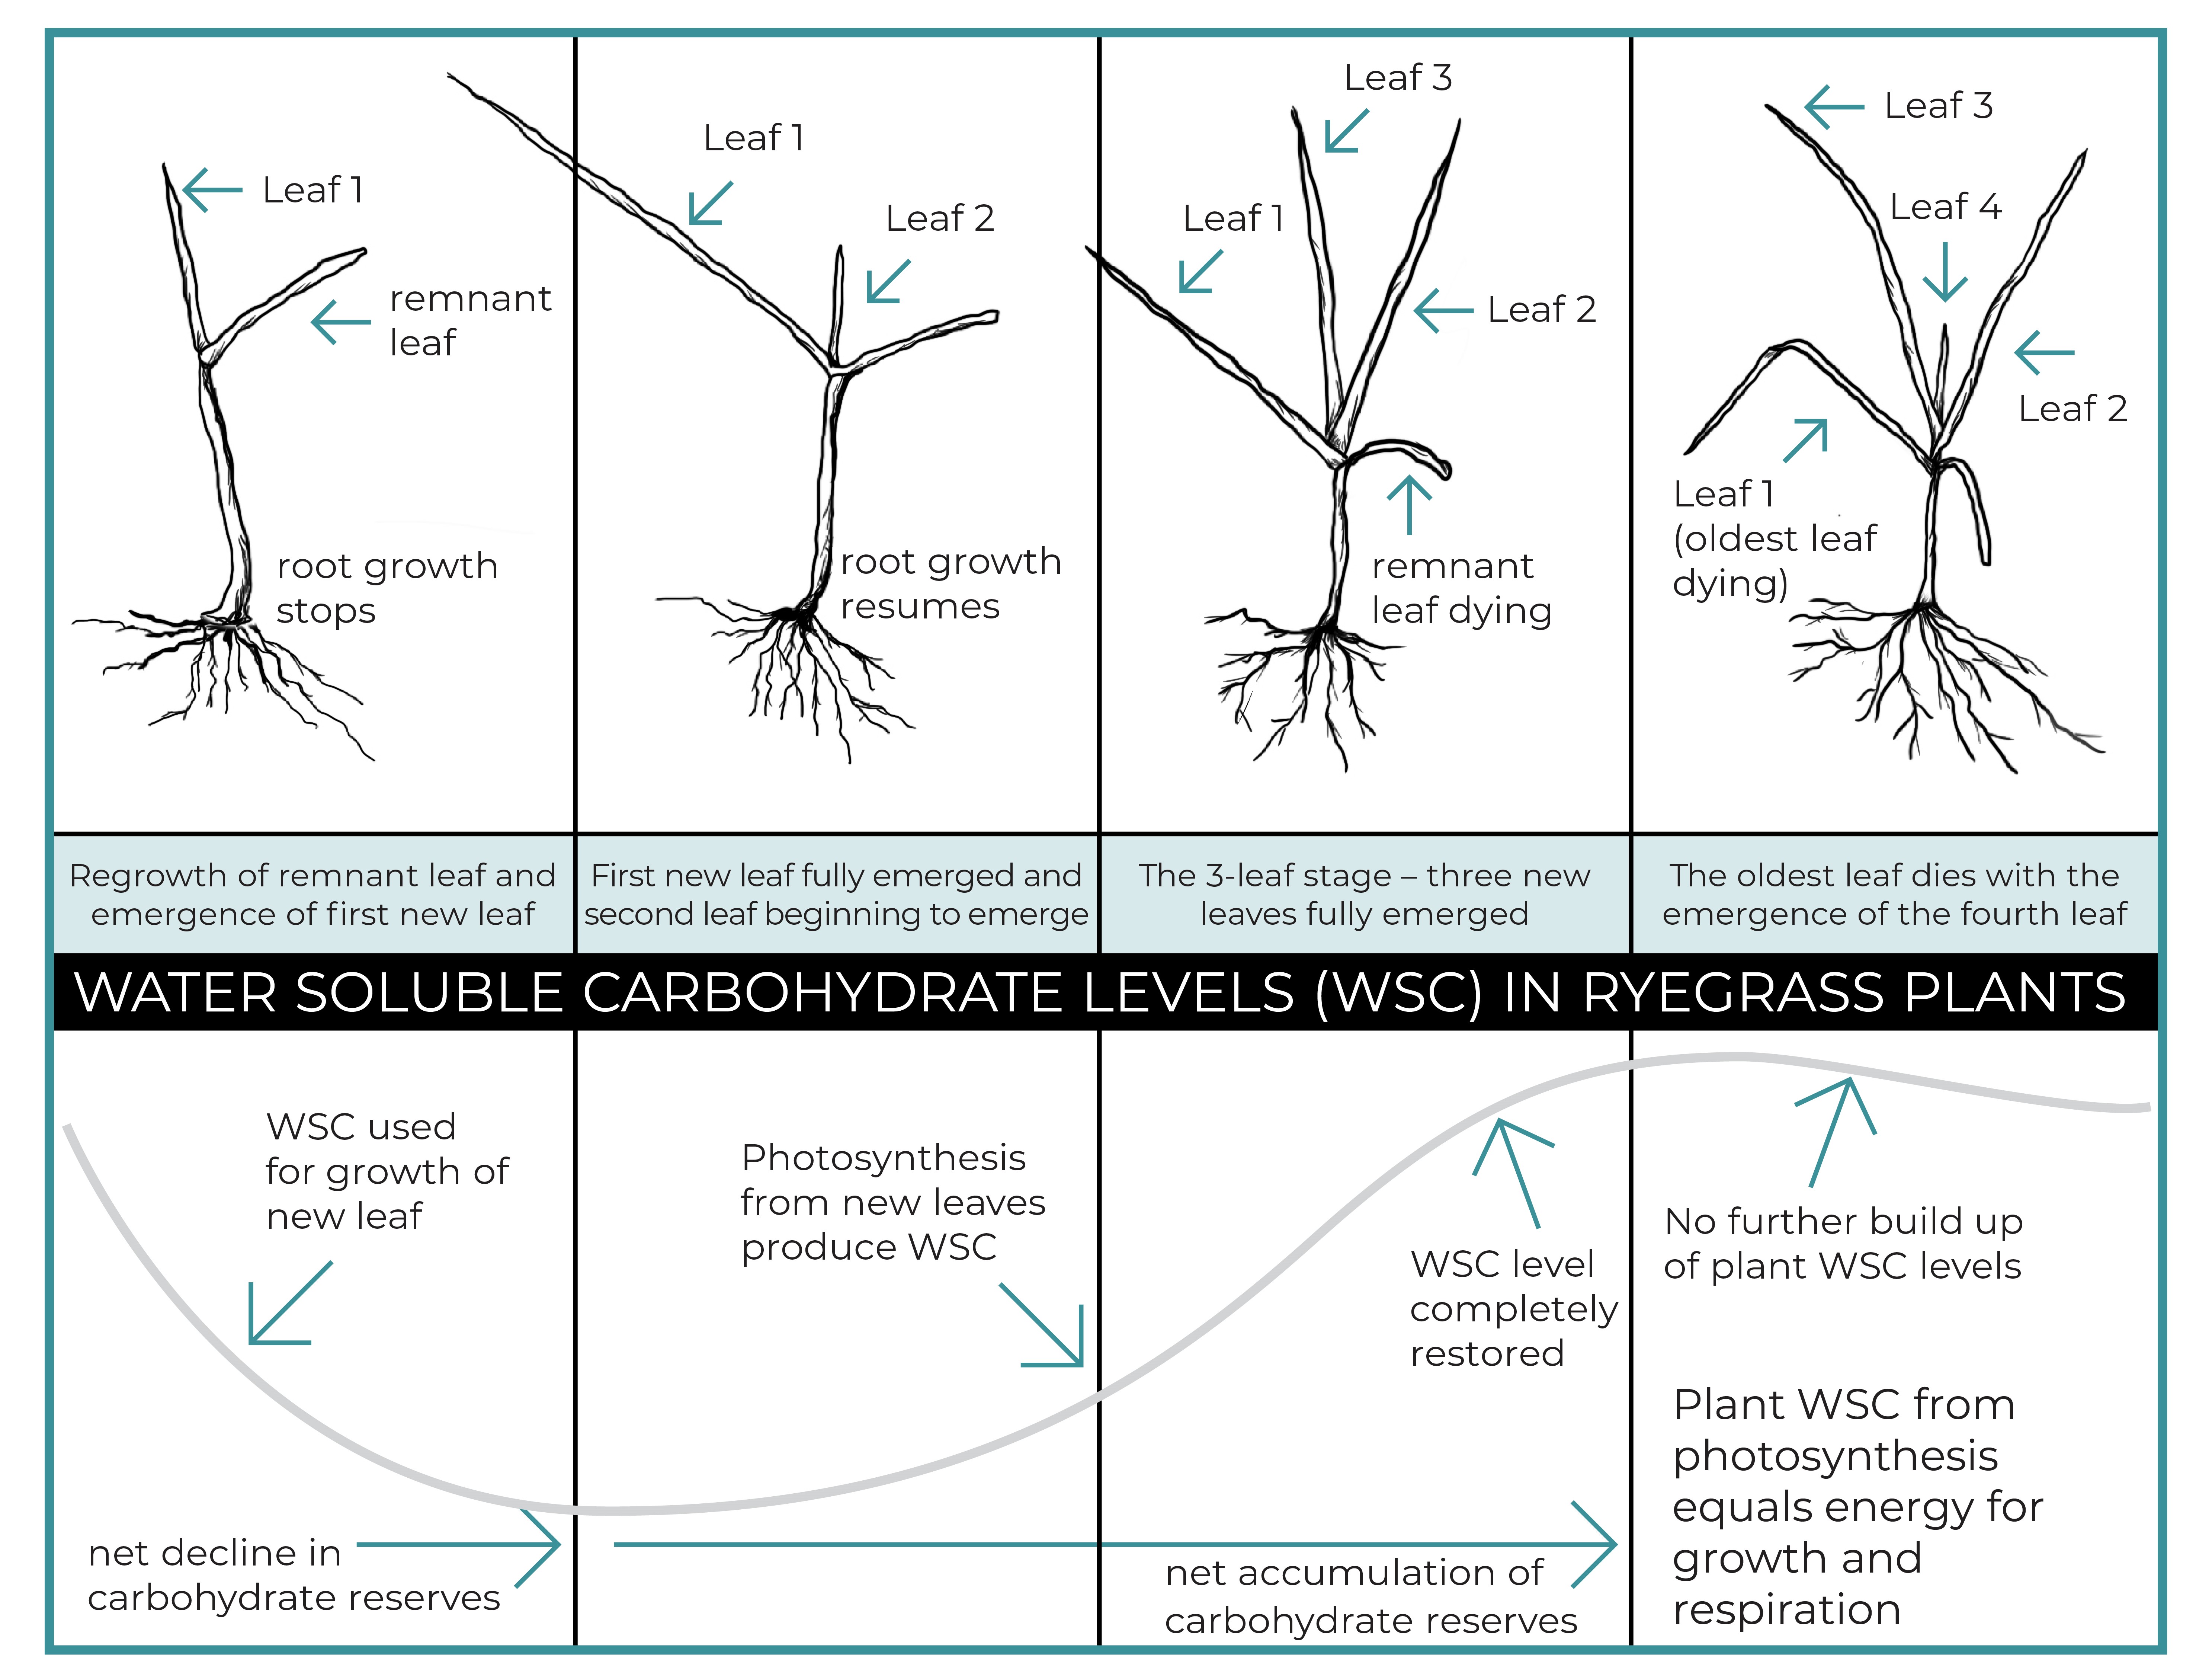
The same principles apply to all grasses, but most perennial pasture species grow four live leaves rather than the three shown here for ryegrass. Many perennial tropical grasses grow six leaves.
For a video on counting leaf stage go to www.youtube.com/watch?v=IGIgulwwb0w.
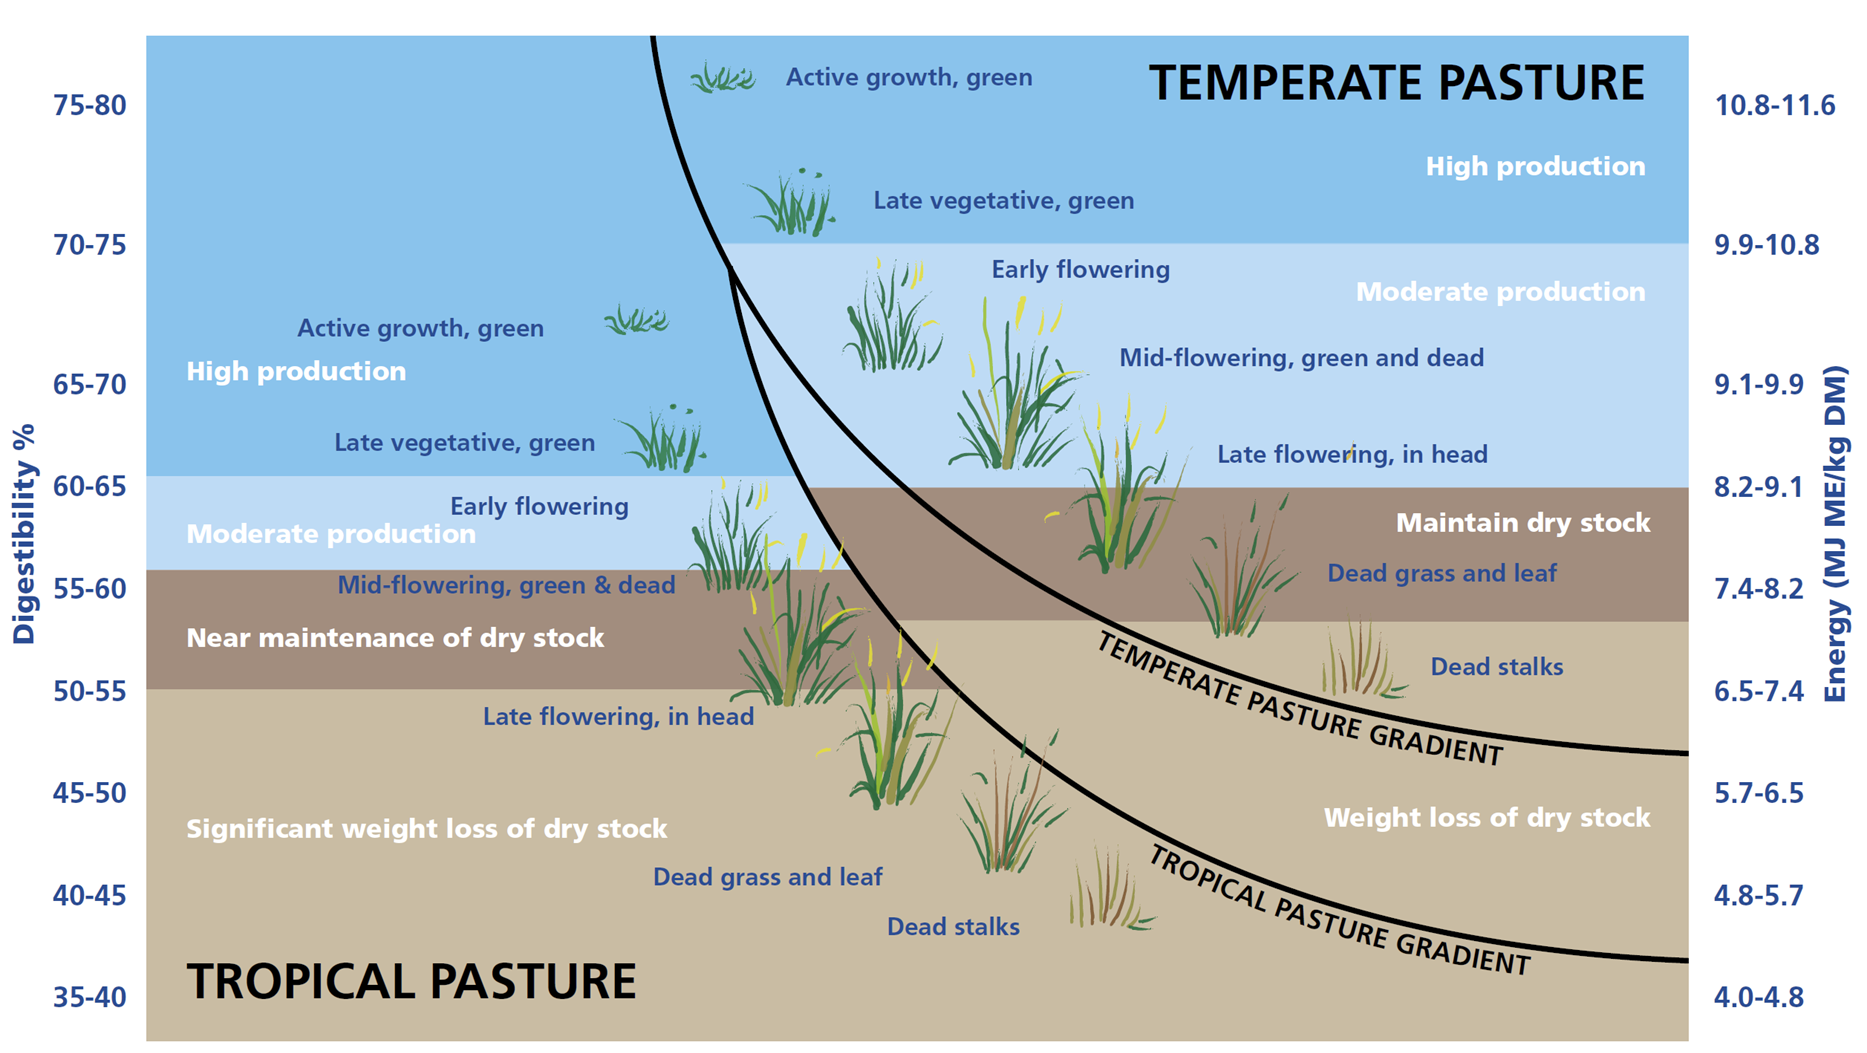
Pasture quality
Assessment of pasture quality (energy content) normally requires laboratory analysis. Field observations provide a useful guide to energy content, expressed as megajoules of metabolisable energy per kilogram of dry matter (MJ ME/kg DM).
Temperate pastures
Actively growing green material is normally in the range of 11.0 to 12.0 MJ ME/kg DM.
Actively growing legumes normally have slightly higher energy content (+0.5 MJ ME/kg DM) than perennial grass.
Therefore, pasture that is 100% green, has legume and perennial grass composition within the limits of 20–30% legume and 60–70% grass and the oldest leaf of the dominant grass has not started to senesce can be assumed to have an energy content greater than 11.5 MJ ME/kg DM. Energy declines as temperate pastures mature.
Sub-tropical pastures
Sub-tropical grasses mature and digestibility declines more rapidly than in temperate grasses. This means that the ‘window’ for moderate to high animal production is smaller without appropriate grazing management and may not be sustained for lengthy periods.
The steeper decline of tropical pasture compared to temperate pasture can be seen in figure 7.7.