Chapter 6.3 Test and observe soils for key indicators of soil health
Background information
Standard soil tests can provide a lot of information about your soils and differences between paddocks, no matter what your attitudes and preferences about soil management techniques or fertilisers. Soil nutrient deficiencies and cation imbalances related to soil structure can have a compounding impact — these soils are likely to have poor plant and root growth, low groundcover and litter levels and, therefore, lower water holding capacity and soil organic matter supporting fewer soil organisms such as bacteria, fungi and earthworms.
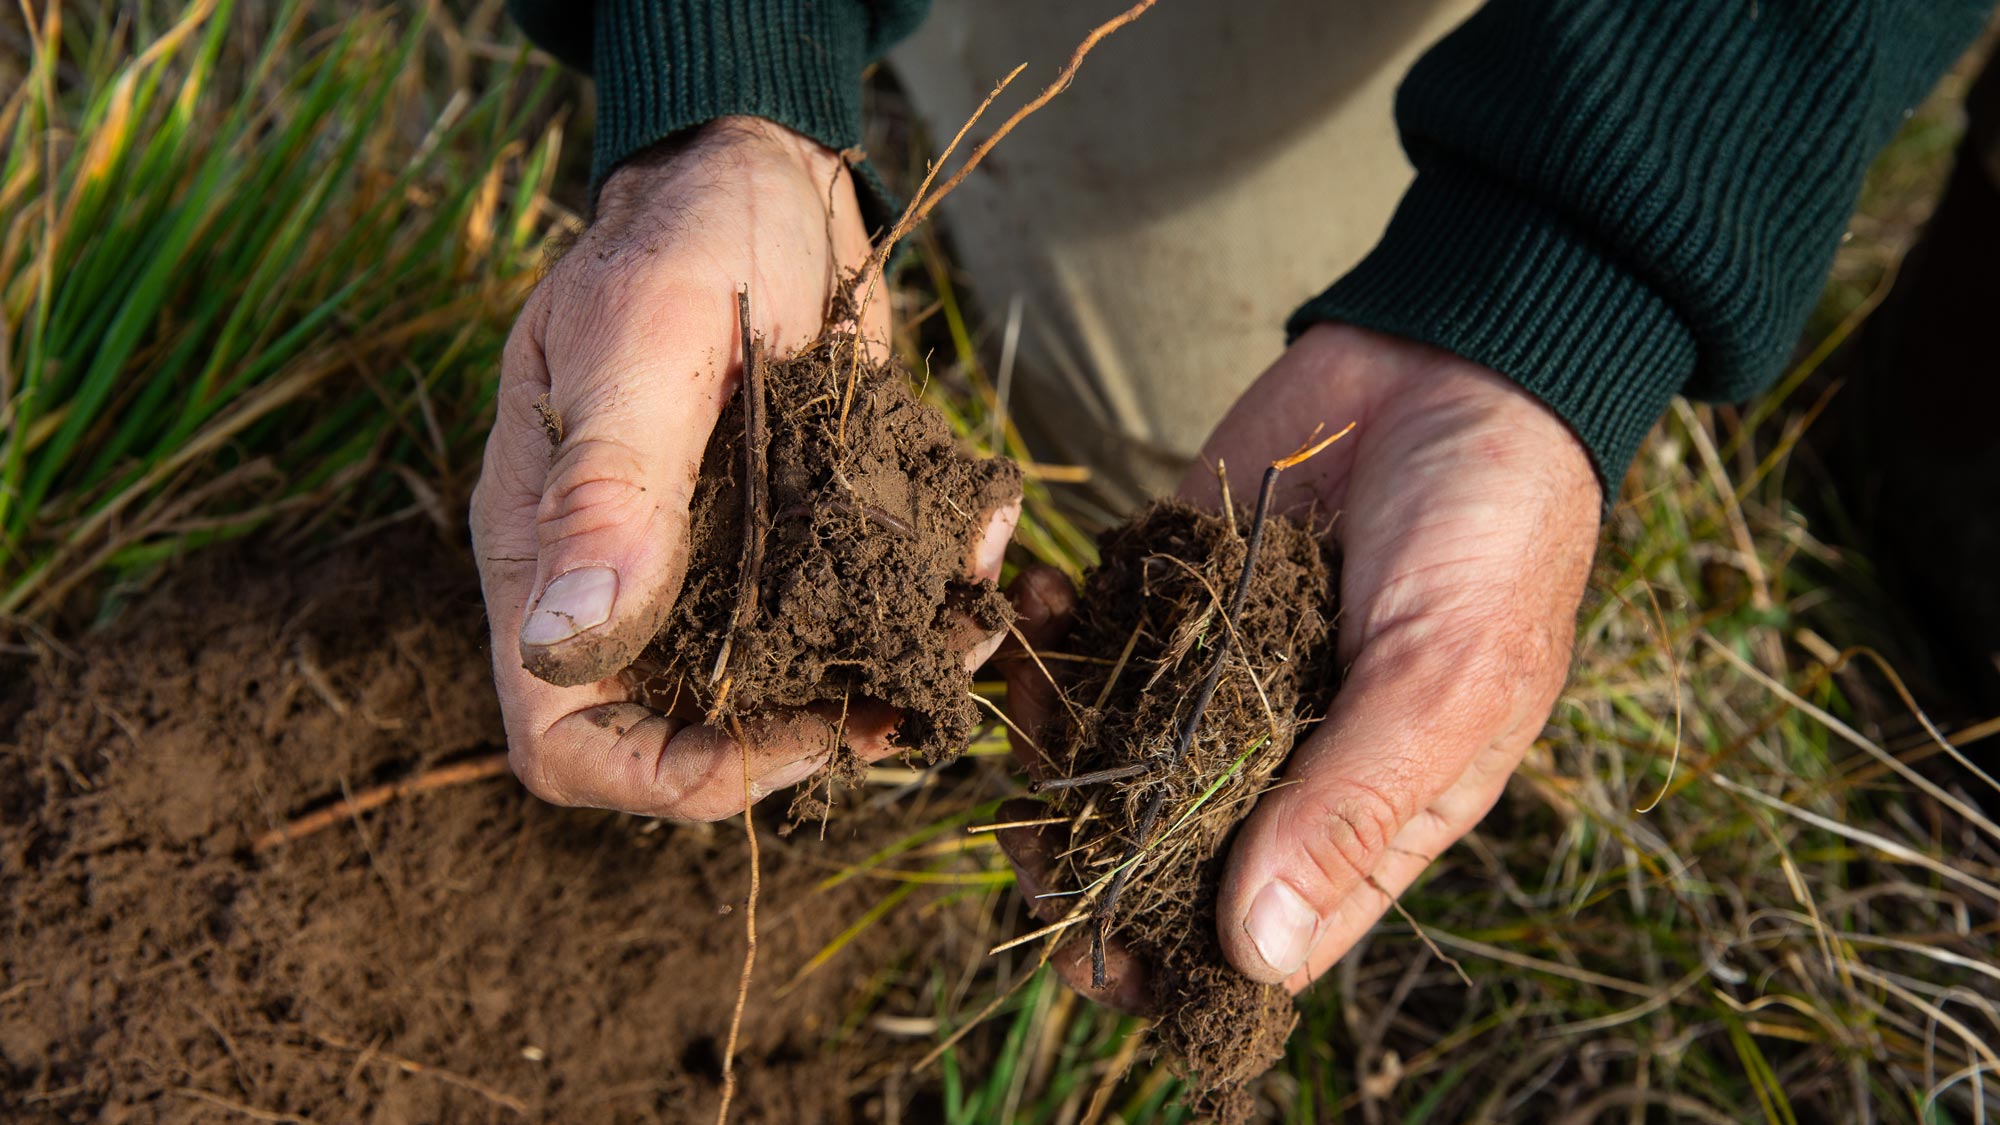
In addition to laboratory testing, visual indicators of soil condition, such as pasture discolouration and growth, large bare patches, areas with high weed growth, pooling water, the number of earthworms present, and the look, smell and feel of soil can give important indications of soil health.
This chapter covers taking a soil test, interpreting the results, and identifying soil health problems such as soil acidity or sodicity.
Supplying nutrients through fertiliser investment decisions, to maintain or lift pasture growth and maximise profit, are dealt with in Chapter 7.1 in MMFS Module 7 Grow More Pasture.
At a glance
- Use soil tests to help monitor nutrient levels and soil health on different areas of your property.
Soil testing provides a range of information on nutrient levels, conditions and other measures, such as carbon status. Tests can identify if there is an aspect of the soil which is limiting production and also rate soil conditions against industry benchmarks. The results can be used to determine if inputs are required and what nutrient or product can be applied to address the deficiency. Understanding soil test results gives you the confidence to invest in appropriate inputs to address aspects of soil fertility and conditions which can limit production and can help identify which is the most cost-effective product to apply.
Standard soil tests provide an analysis of:
- Fertility: nitrogen (N), phosphorus (P), sulphur (S) and potassium (K)
- Soil acidity: pH (usually in calcium chloride (CaCl2) and water), exchangeable aluminium (Al)
- Salinity: electrical conductivity (EC)
- Soil structure: texture, colour, organic carbon, calcium:magnesium ratio, exchangeable sodium percentage (ESP)
- Tests for interpretation of product type and rate: Phosphorus Buffer Index (PBI), cation exchange capacity (CEC)
The three most commonly deficient nutrients are phosphorus, potassium and sulphur.
Phosphorous (P)
Phosphorous is measured as Olsen P or Colwell P. Olsen P measures the amount of nutrient immediately available to plants. Olsen P remains stable throughout the year. Colwell P measures the immediately available phosphorous (Olsen P) plus the phosphorous that is bound to the soil particles and released over time. This means the Colwell P is always higher than the Olsen P. The relationship between Olsen P and Colwell P varies with soil type.
Potassium (K)
Potassium levels are measured using the Colwell K test which identifies the amount of nutrient immediately available to plants and remains relatively stable throughout the year.
Sulphur (S)
Sulphur is assessed using the KCL 40 test which identifies the amount of sulphate sulphur immediately available to the plant. Other sulphur – elemental sulphur – is stored in organic matter and only becomes available as organic matter breaks down.
Other nutrients
Trace elements such as copper (Cu), zinc (Zn), manganese (Mn), iron (Fe) and boron (B) are only required in small amounts. Soil testing only provides a guide to the levels in the soil and can help identify gross deficiencies or toxic levels. Tissue testing provides a more accurate measure of trace element imbalances.
Soil acidity (pH) and aluminium (Al)
Soil acidity and alkalinity are measured as pH. There are two methods to measure pH – one is in calcium chloride (CaCl2) and the other is in water (H2O). The water measure is the traditional method but results can vary throughout the season.
Aluminium is stored in the soil in a number of forms that can be toxic to some plants. The level of toxic aluminium is affected by pH. As pH decreases (soils become more acid), more aluminium is converted to the toxic form.
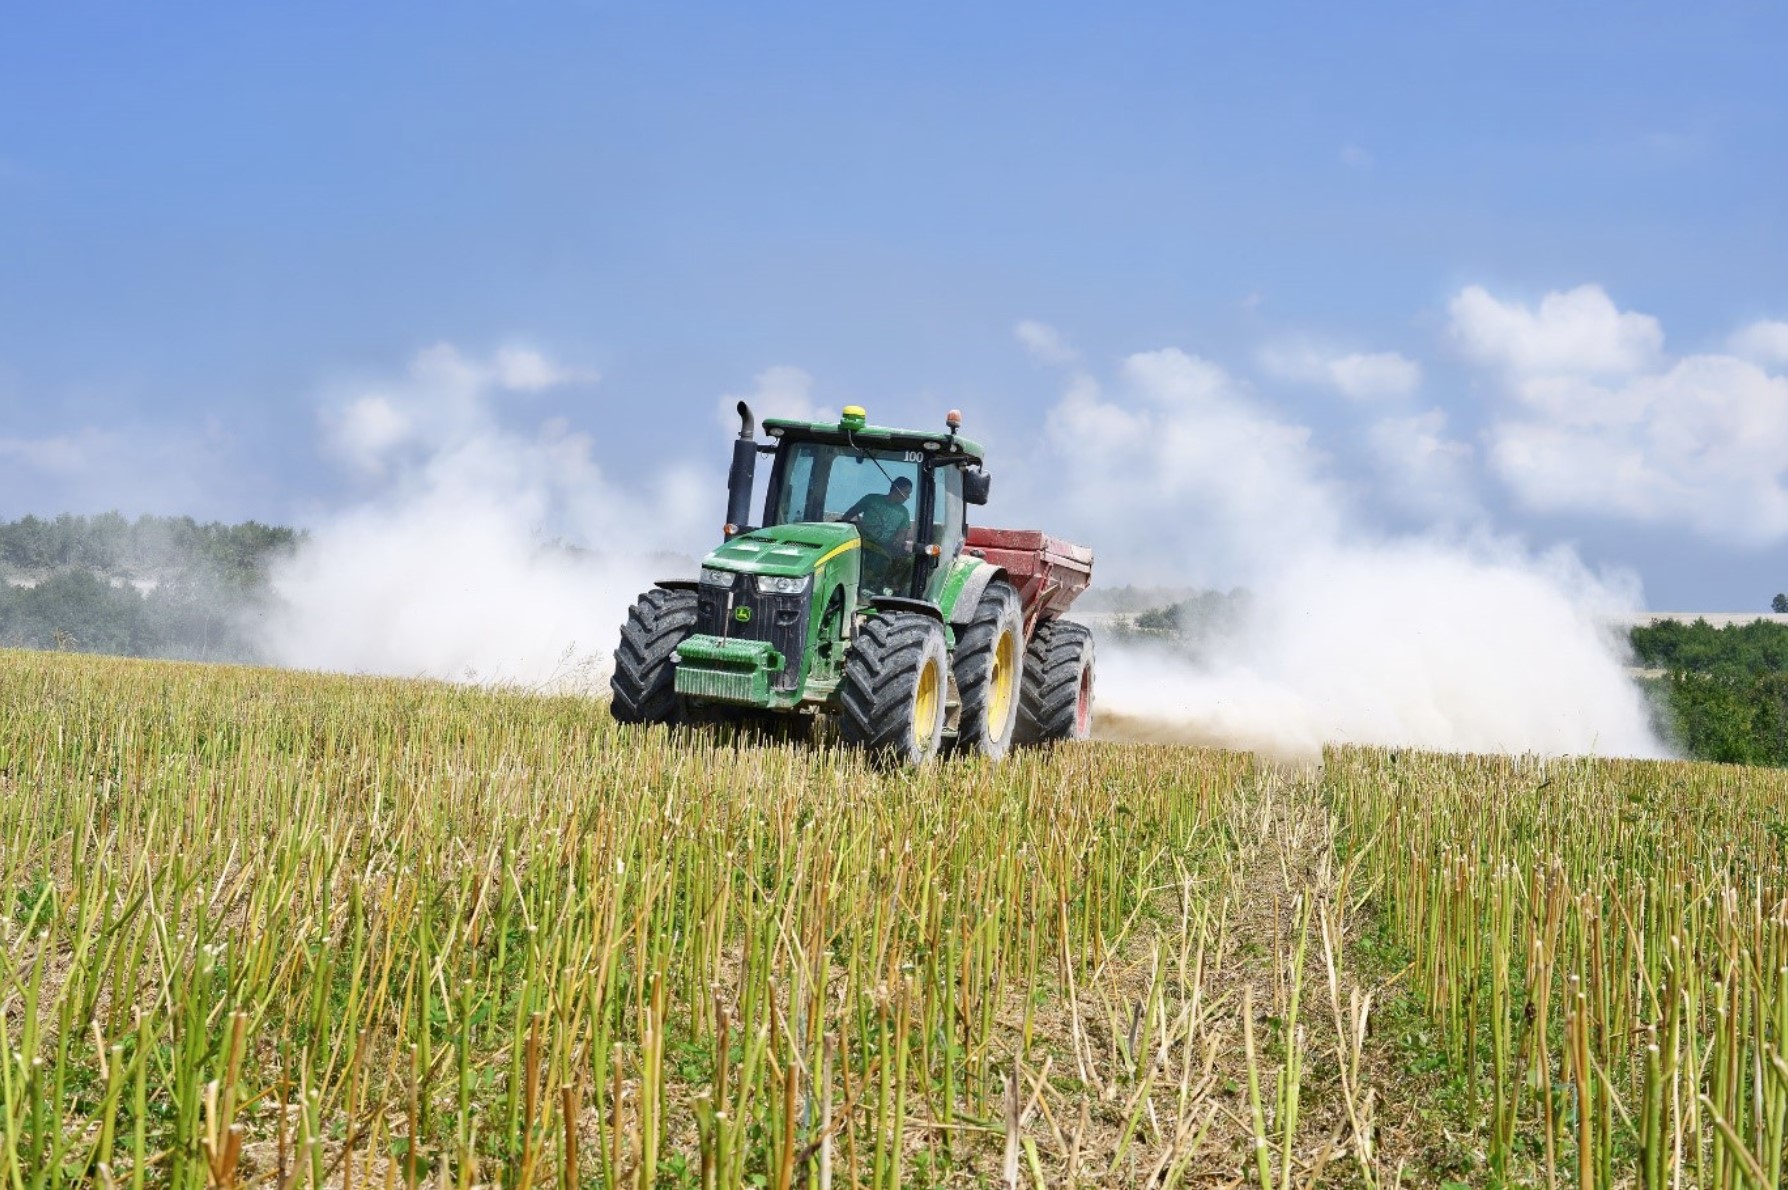
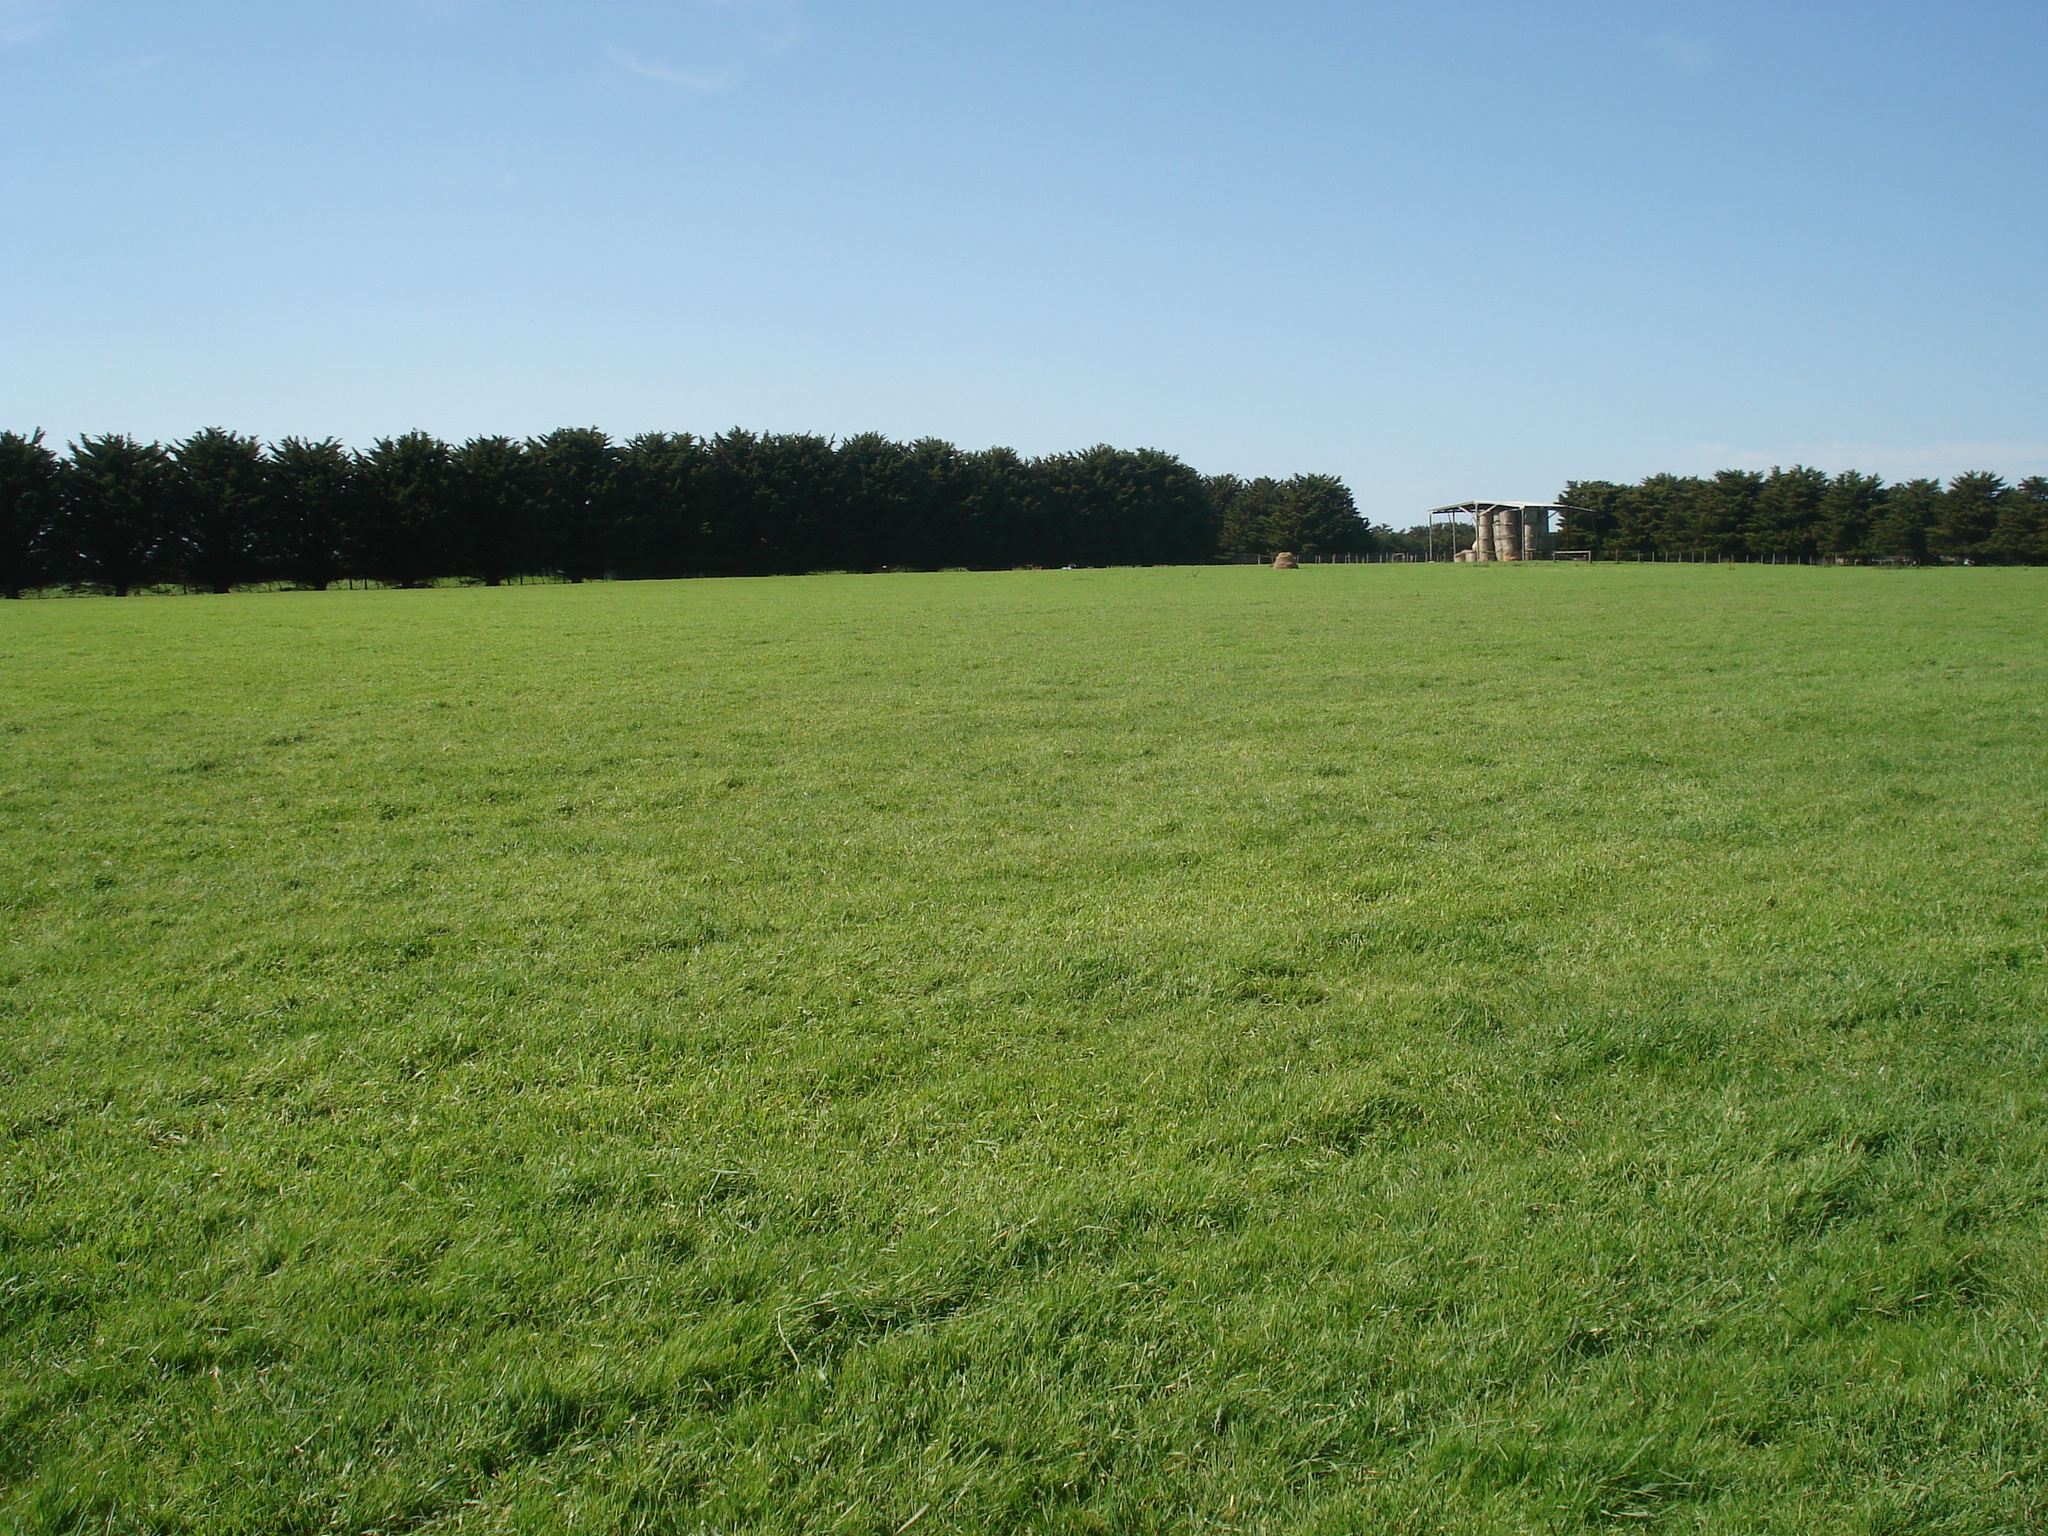
Figure 6.3 In a lot of acid soils, lime is a necessary input to ensure maintain a healthy growing environment.
Source: NSW DPI
Salinity
Salinity is measured using electrical conductivity (EC) by passing a current between a water extract from the soil sample. As salt conducts electricity, the more total soluble salt (TSS), the higher the reading, which is recorded in deci-siemens per centimetre (dS/cm).
Soil structure
Poor soil structure affects root growth and water infiltration. The stability and structure of soil depends on soil organic matter, the levels of calcium (Ca), which hold soils together, and elements which disperse soil, such as magnesium (Mg) and sodium (Na).
Sodicity refers to a soil property where a significant proportion of sodium exists in the soil compared with other cations on the exchange complex. A soil is considered sodic when there is sufficient sodium to interfere with its structural stability, often affecting plant growth. Sodic soils tend to suffer from poor soil structure, including hard-set soils, hardpans, surface crusting and rain pooling on the surface, which can cause problems for erosion, water holding capacity, water infiltration, drainage, water run-off, plant growth, cultivation and access to paddock with machinery.
Useful soil test results include the ratio of calcium to magnesium (Ca:Mg) and the total amount of sodium compared with other elements (called the Exchangeable Sodium Percentage or ESP).
Additional indicators
A number of other figures and calculations are provided in soil tests which are used to calculate the rate and type of product to apply.
These include the following:
- Phosphorous Buffering Index (PBI): a guide to the amount of phosphorous applied to a pasture or crop that is ‘locked up’ on soil’s clay particles and is not available for plant growth.
- Cation Exchange Capacity (CEC): cations are soil components that trap and release nutrients to the soil water.
- Soil texture: a measure of the proportion of sand, silt and clay in the soil. It influences the availability of some nutrients, a plant’s reaction to salinity and the requirement of soils for products such as lime and gypsum.
- Organic carbon: levels of organic carbon influence soil structure and CEC. The breakdown of organic carbon is critical to the release of other nutrients.
Take soil samples for testing and interpret the results
Tool 6.6 provides the directions for taking a soil sample for analysis at an accredited laboratory.
While soil tests can help identify which soil factor or factors are limiting production, the target application of various products will depend on the soil type, rainfall, pasture species grown and the stocking rates.
Consult your local agronomist or product reseller to assist you in identifying which deficiency is limiting production and calculating the quantity of particular products to apply in terms of nutrients, lime or gypsum. They can also look at the products available and calculate which one is the most cost‑effective to apply.
Interpreting soil tests as part of developing a fertiliser strategy is discussed in Tool 7.3 in MMFS Module 7 Grow More Pasture which considers the use of phosphorus, potassium, sulphur and nitrogen.
Tool 6.5 is provided to help interpret soil tests for any soil health problems (acidity, sodicity, salinity and trace elements) on your farm.
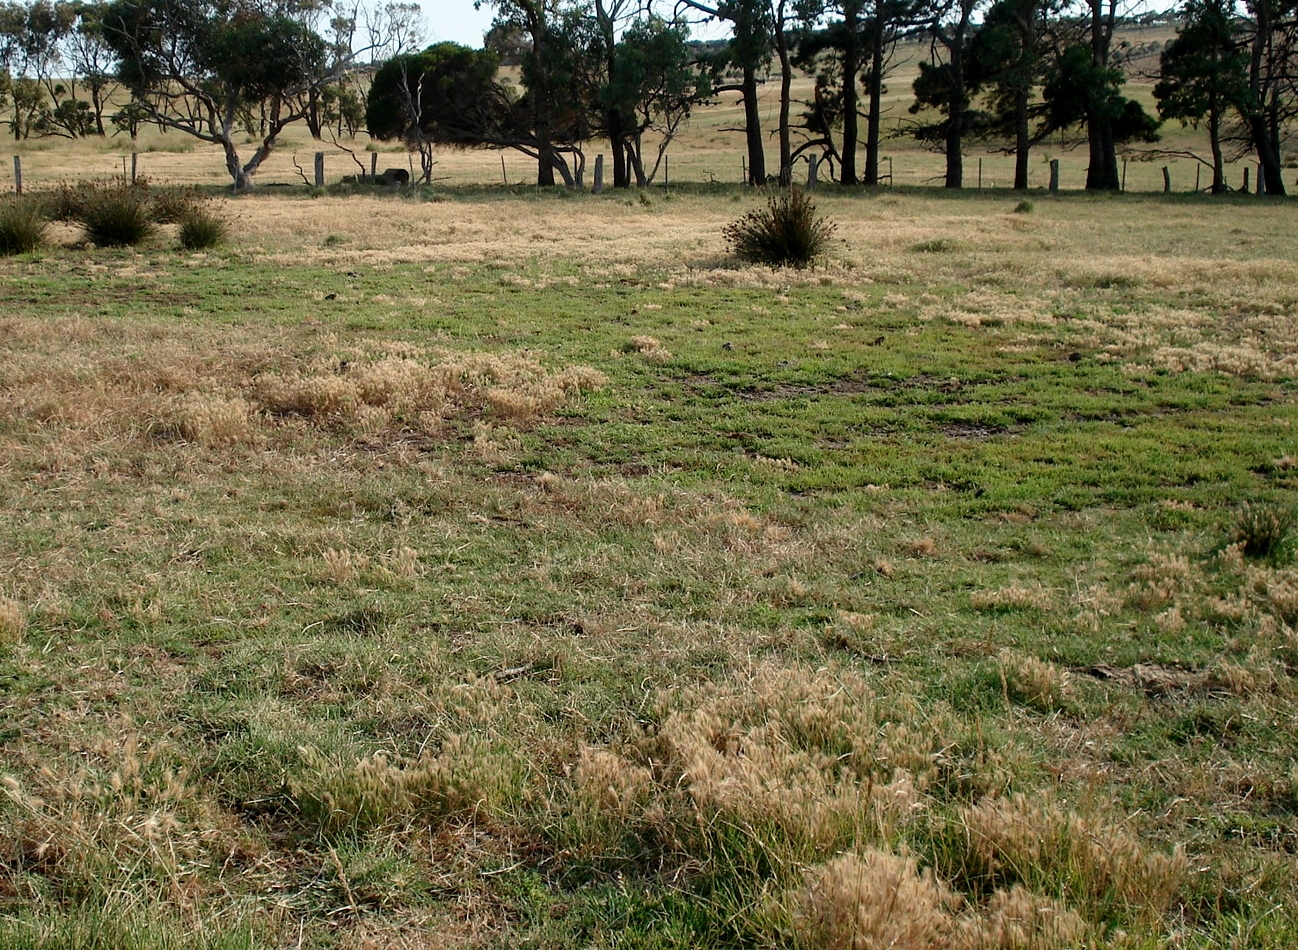
Visual indicators of soil condition
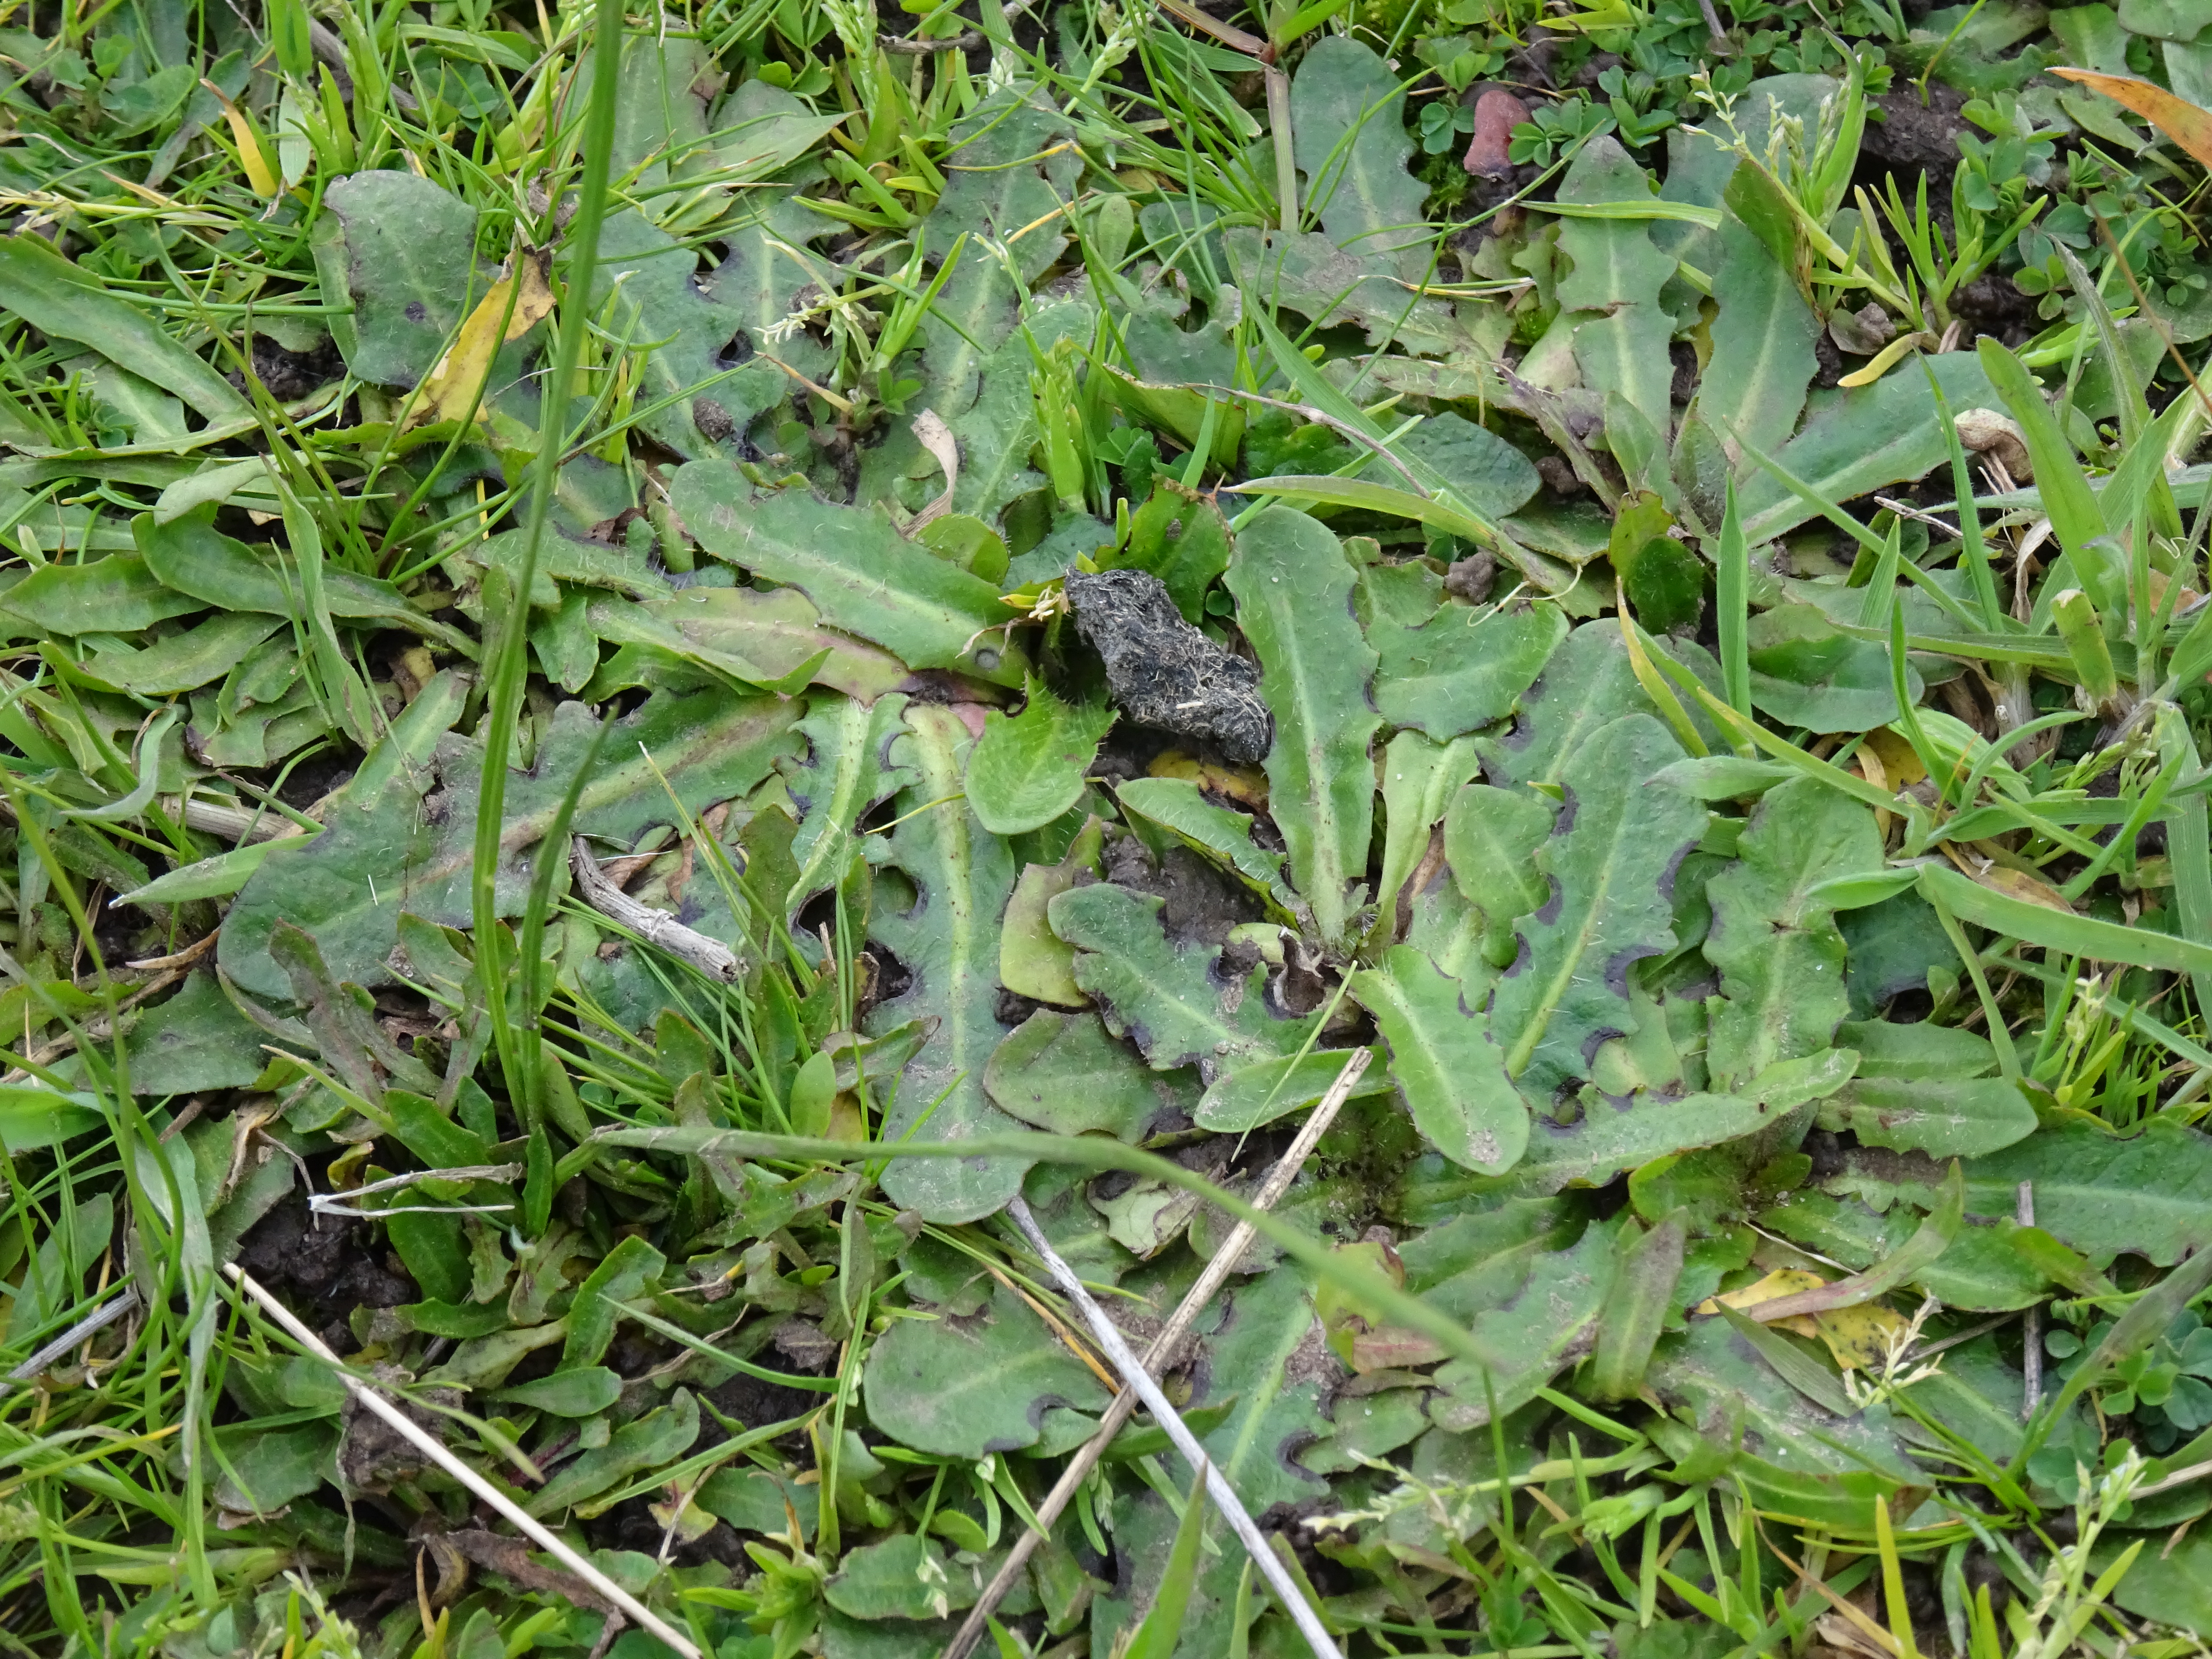
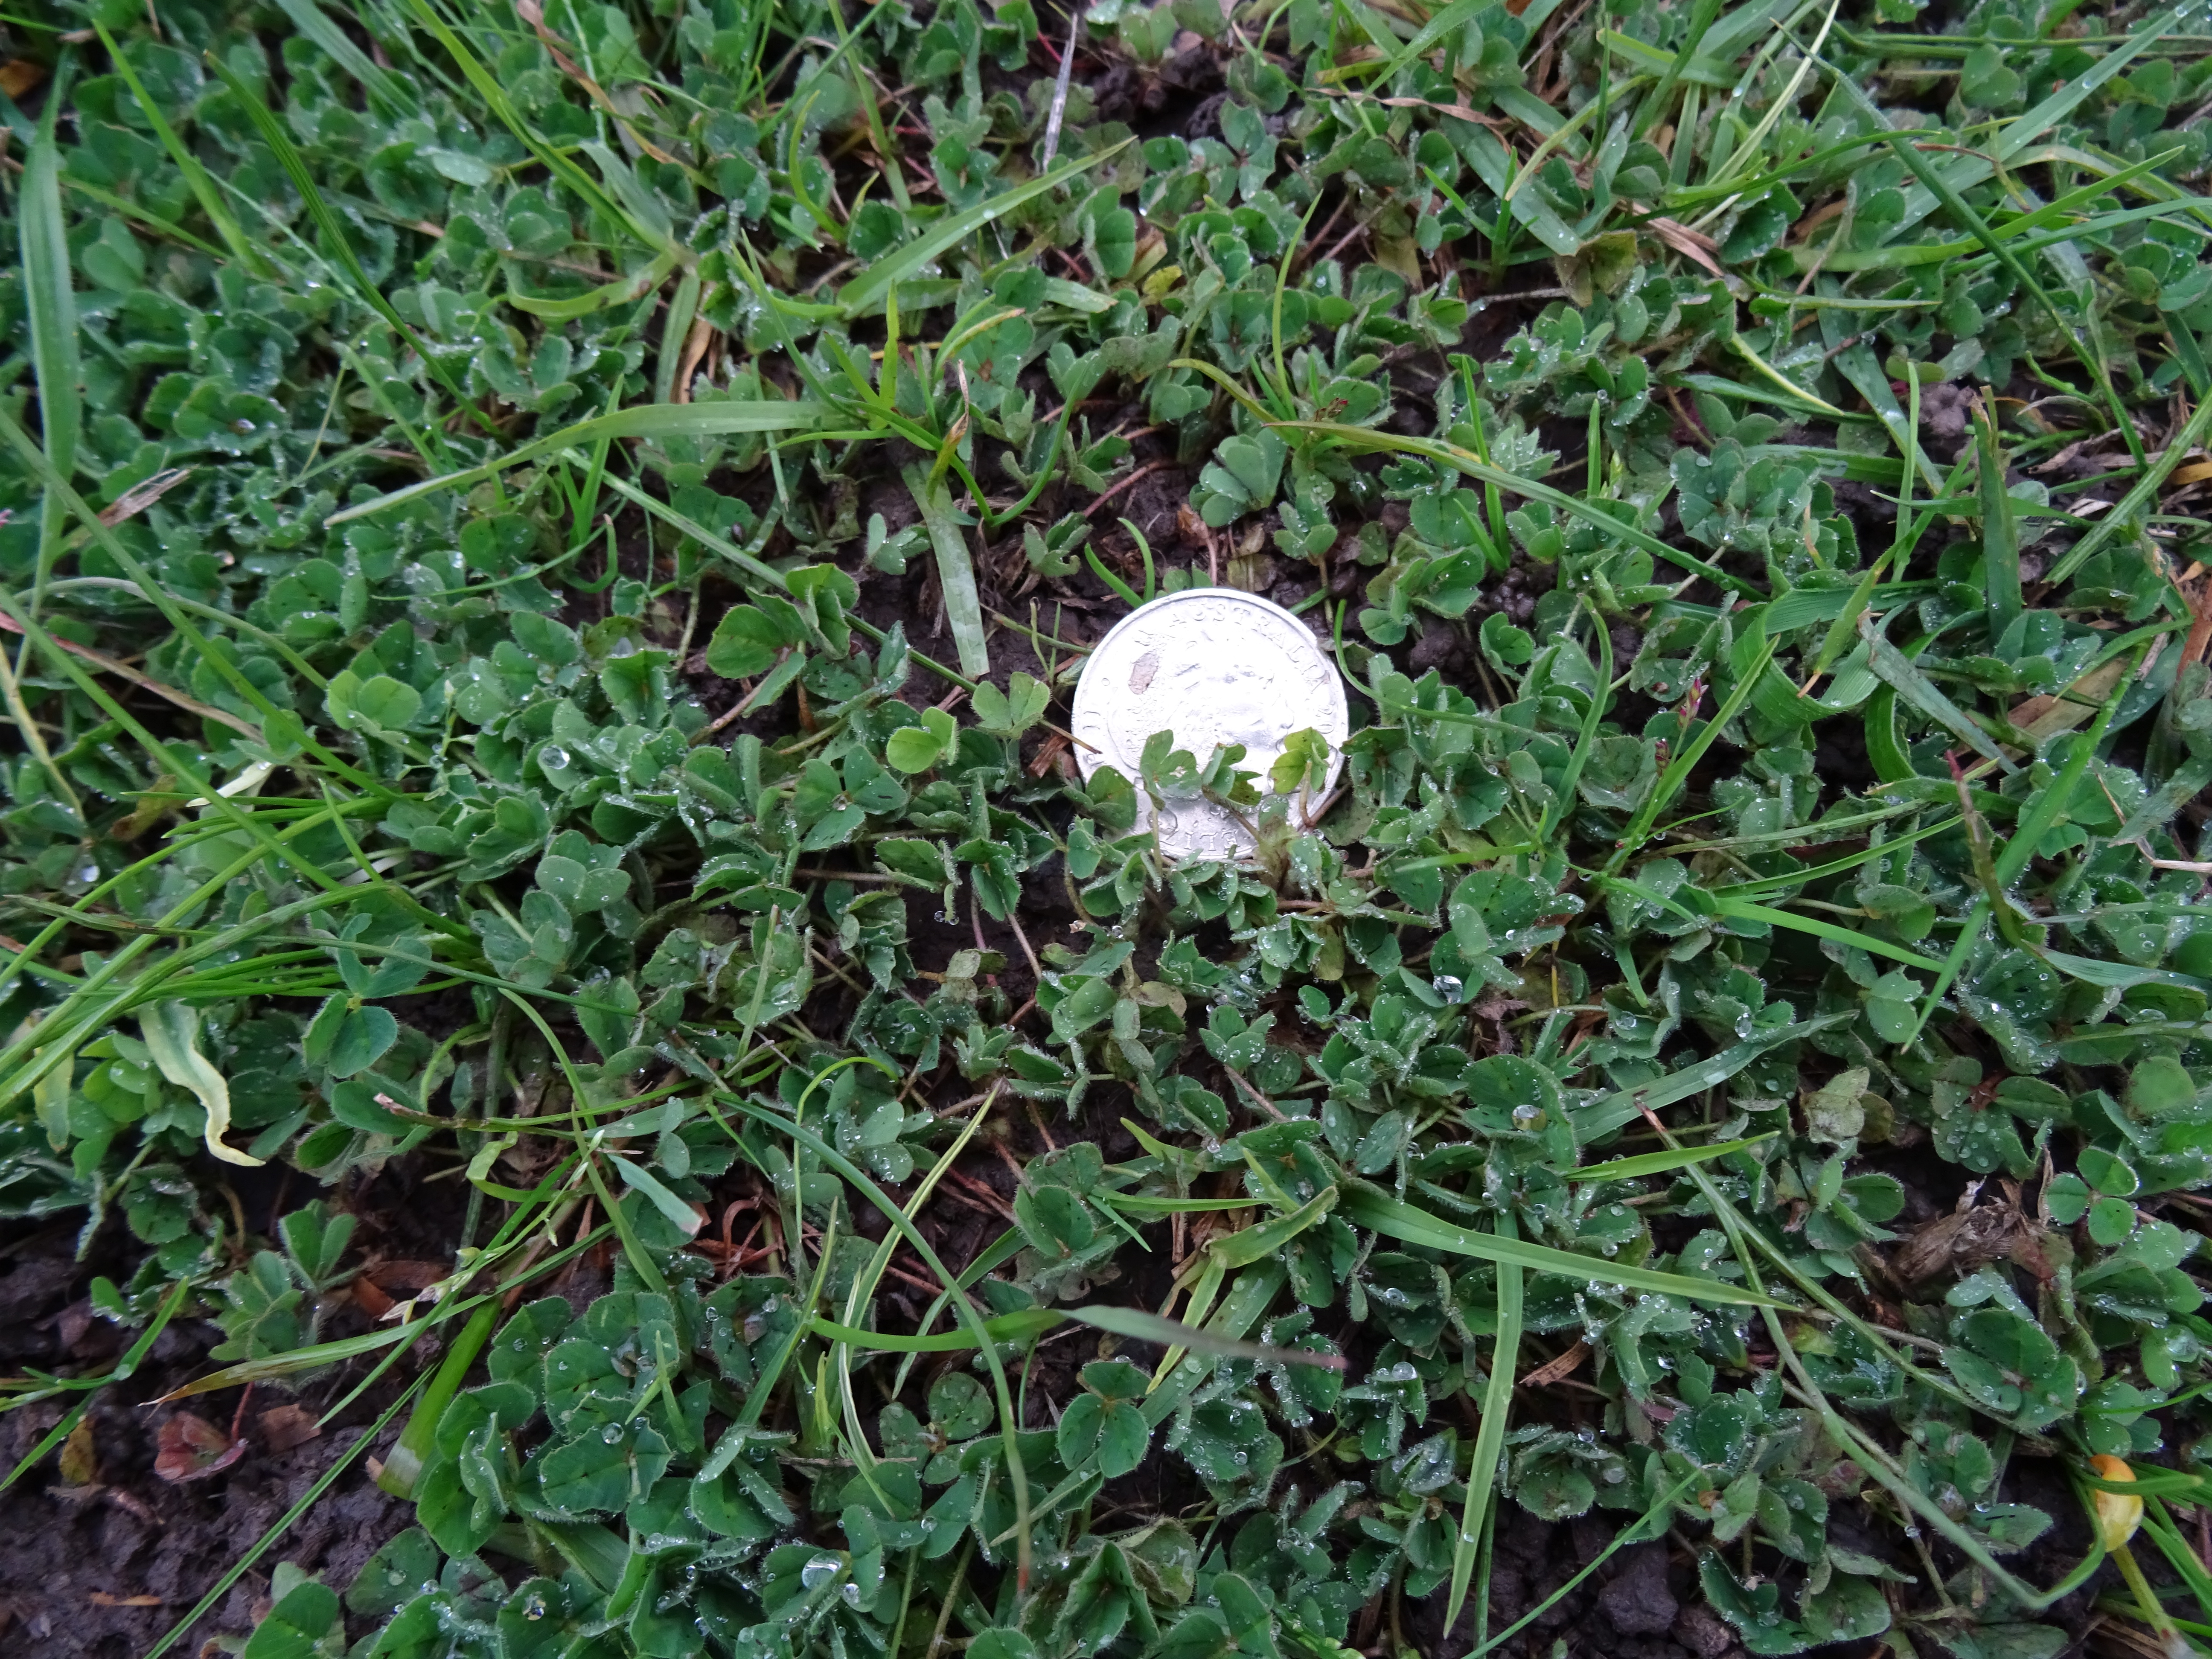
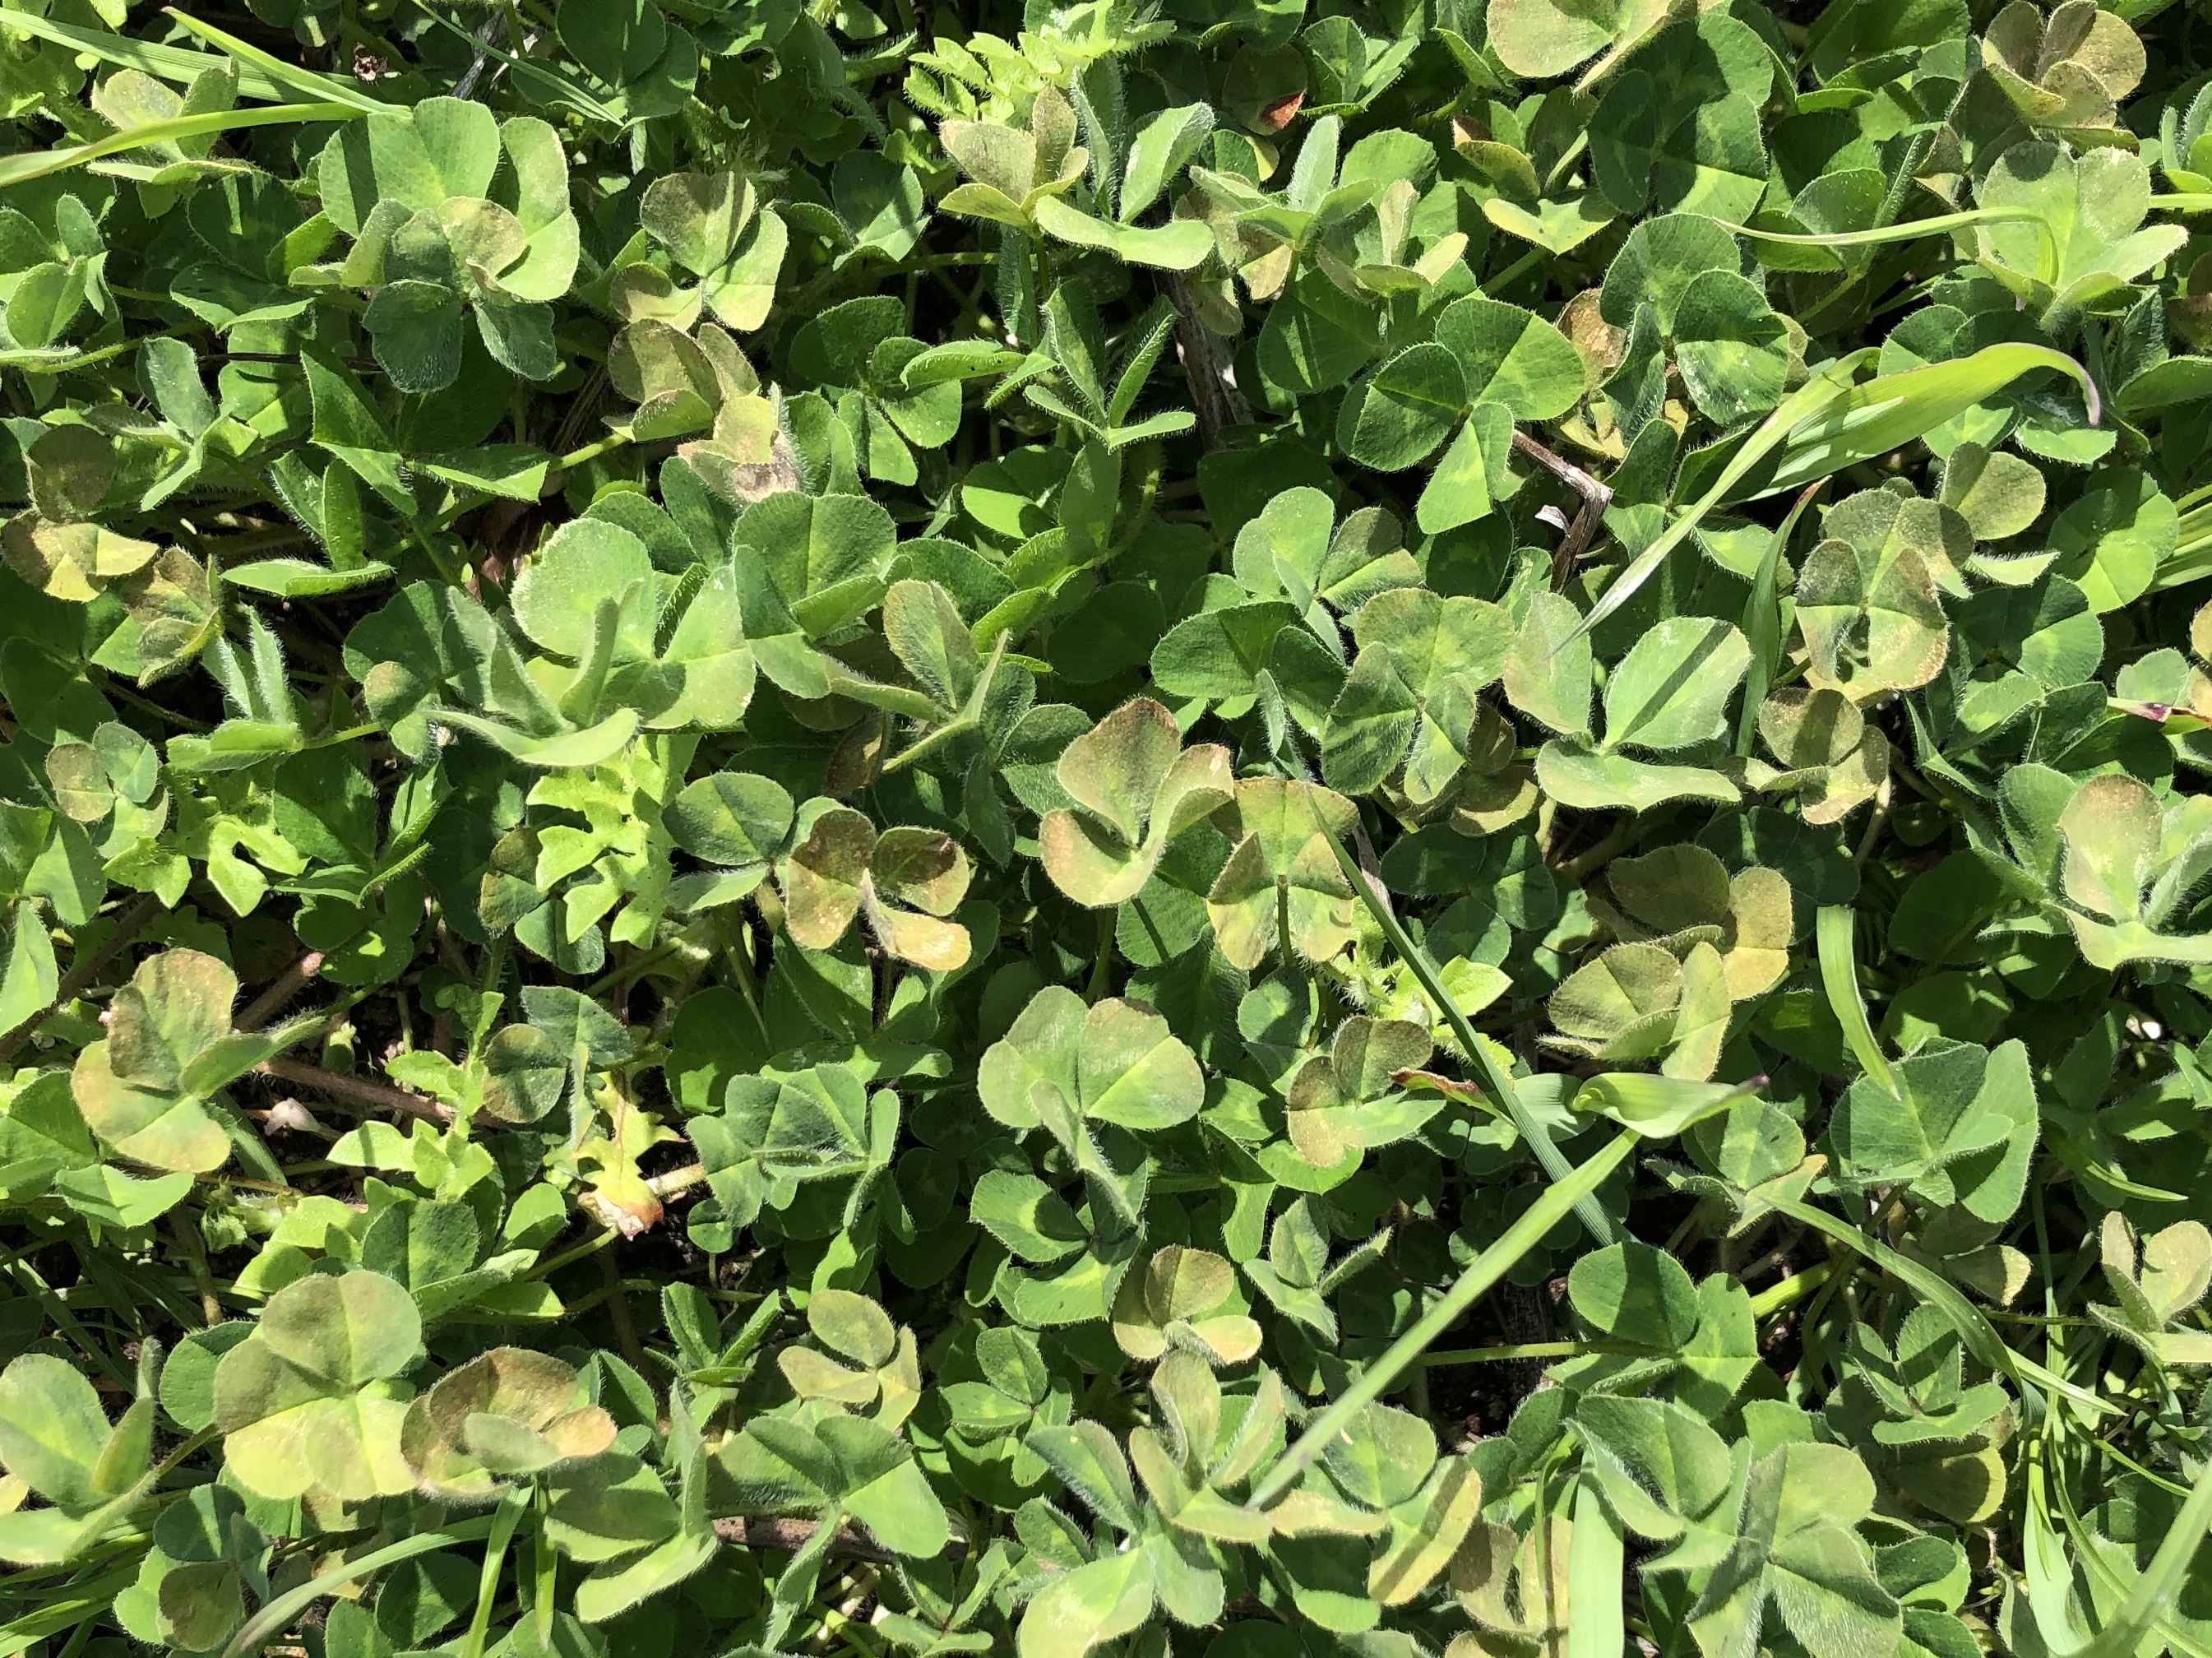
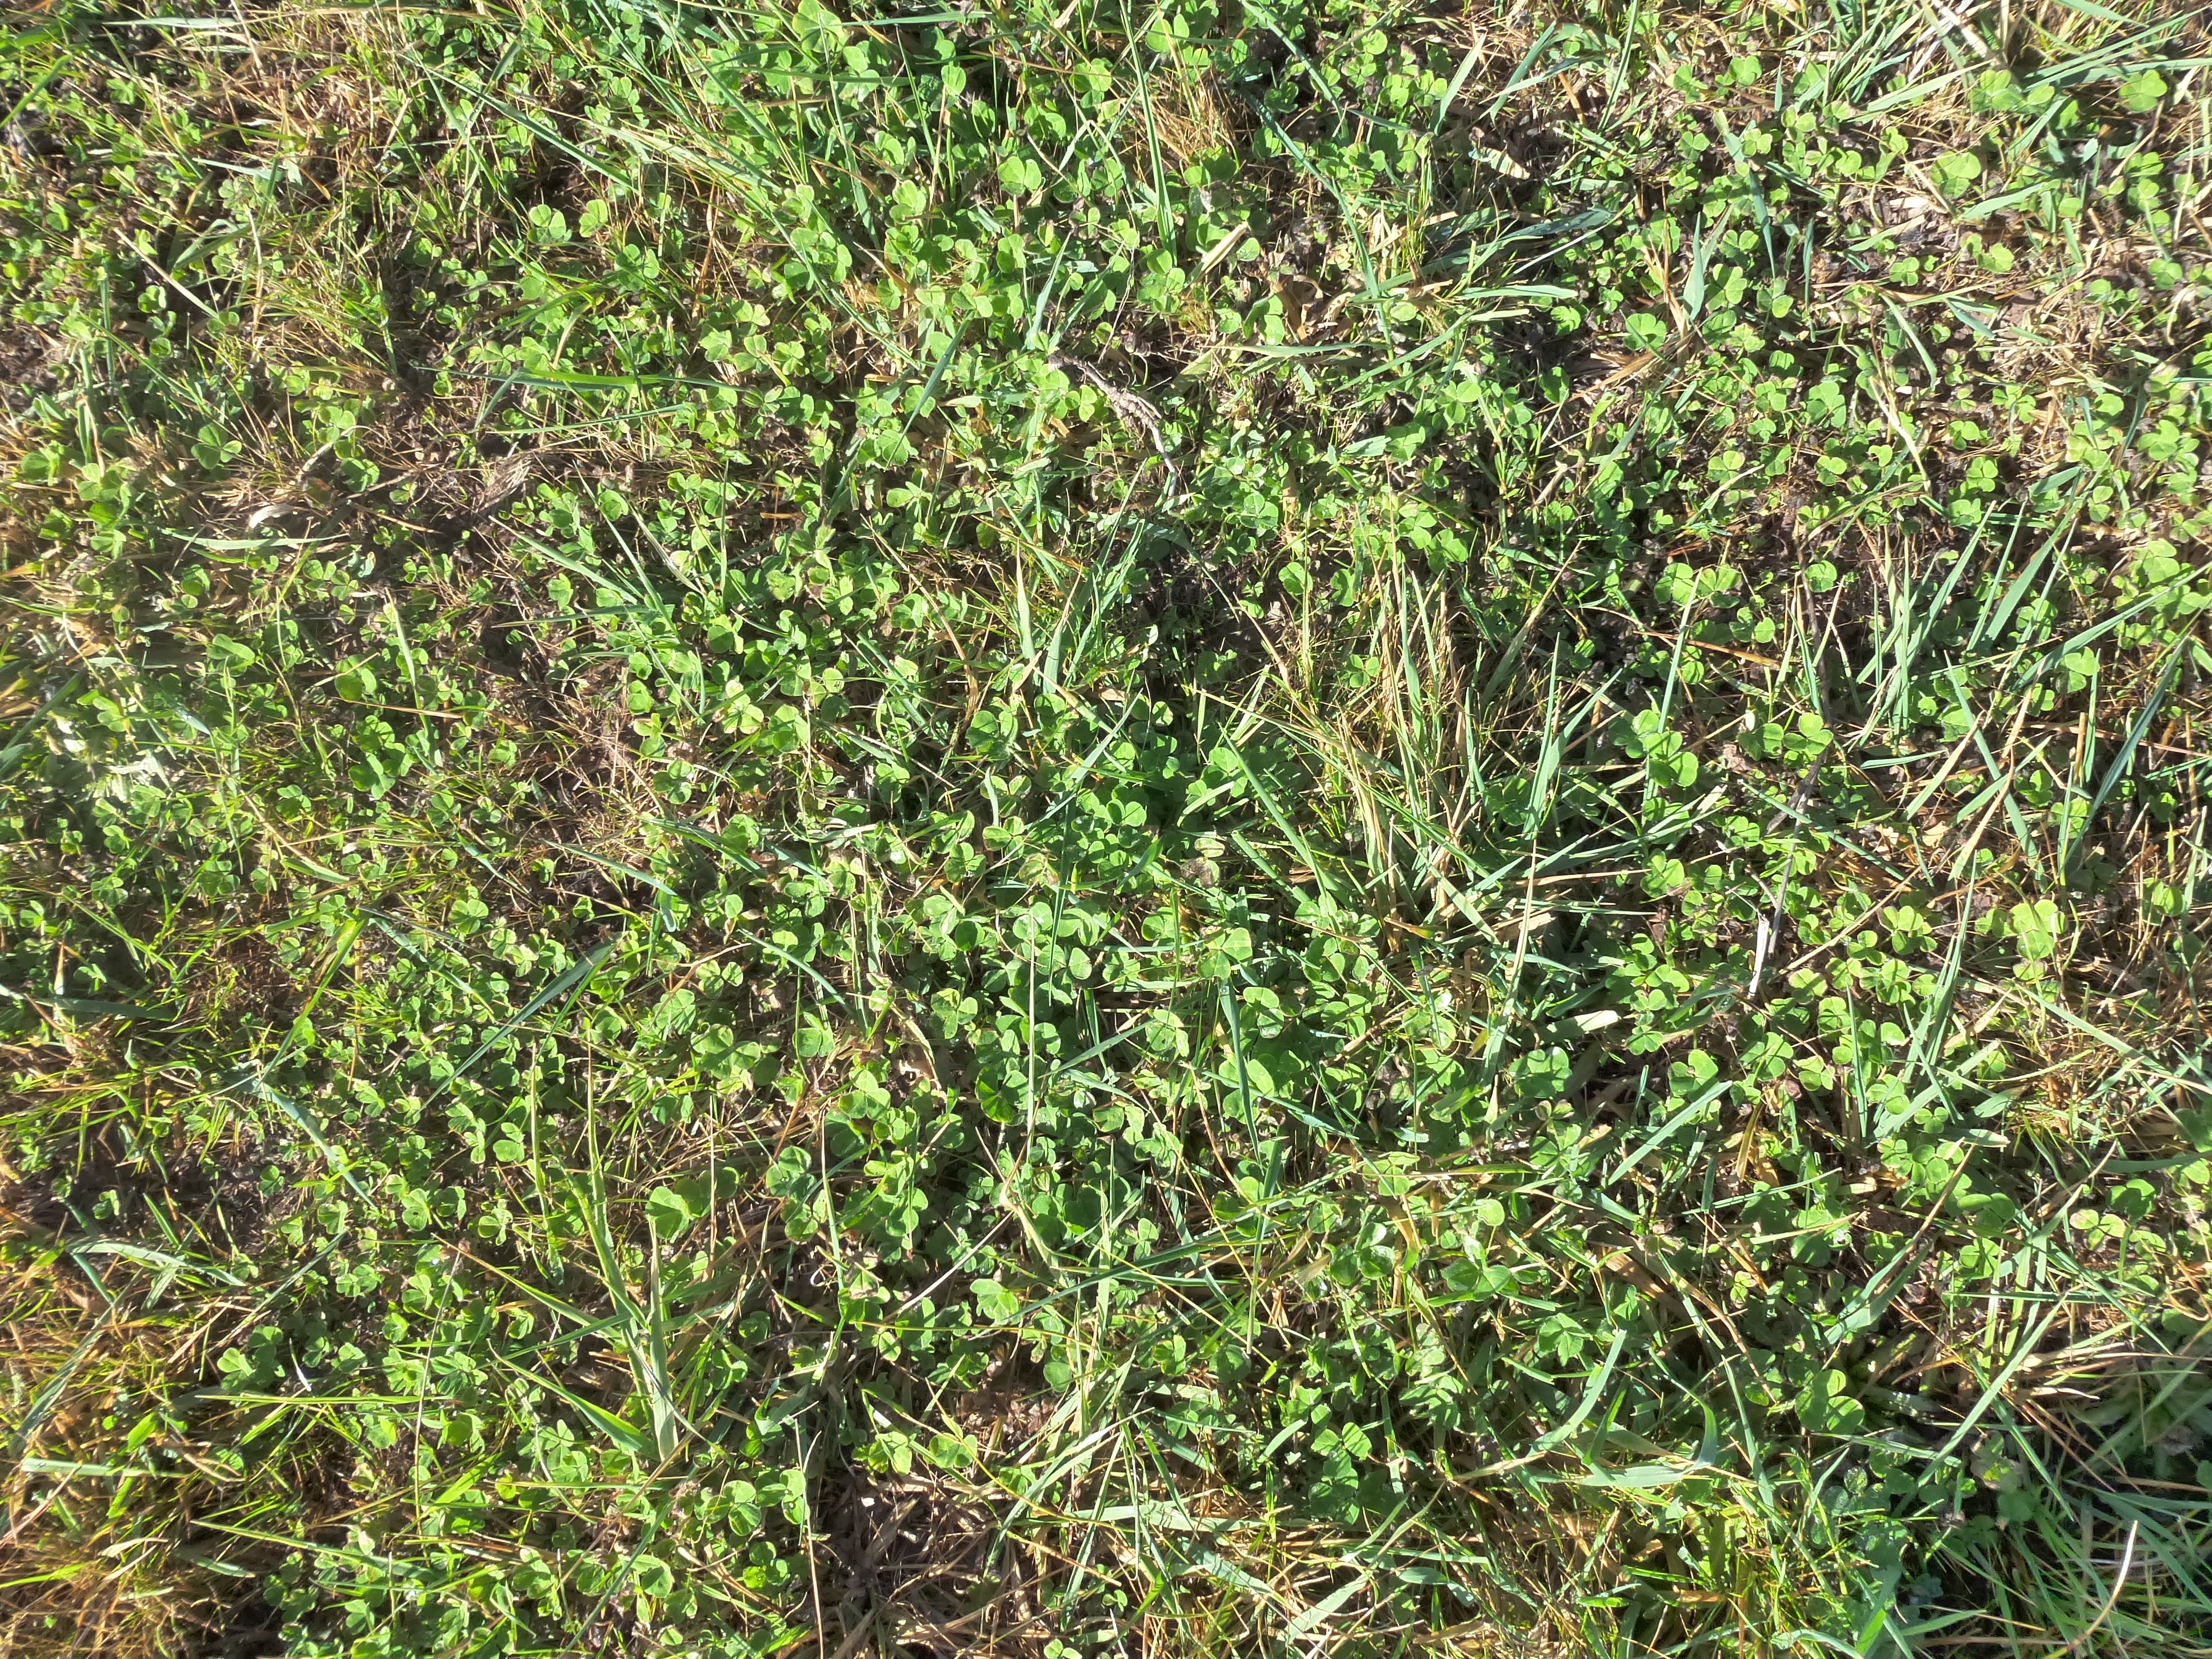
Visual indicators of soil condition can be useful to help diagnose underlying soil constraints, especially in the absence of soil test results. These indicators include general pasture appearance, individual plant symptoms, the type of plants and weeds which grow as well as appearance of the soil itself.
The best time to look for plant indicators of nutrient deficiencies are late winter and early spring. At this time, potassium, nitrogen, and sulphur may have been used up or lost due to wet conditions and nutrient demand by plants is increasing. Fertility indicators include:
Urine or dung patches: Dark green patches with greater growth of grass or clover, paler green in other areas or increased or fast pasture growth surrounding manure pats, shorter paler green growth elsewhere.
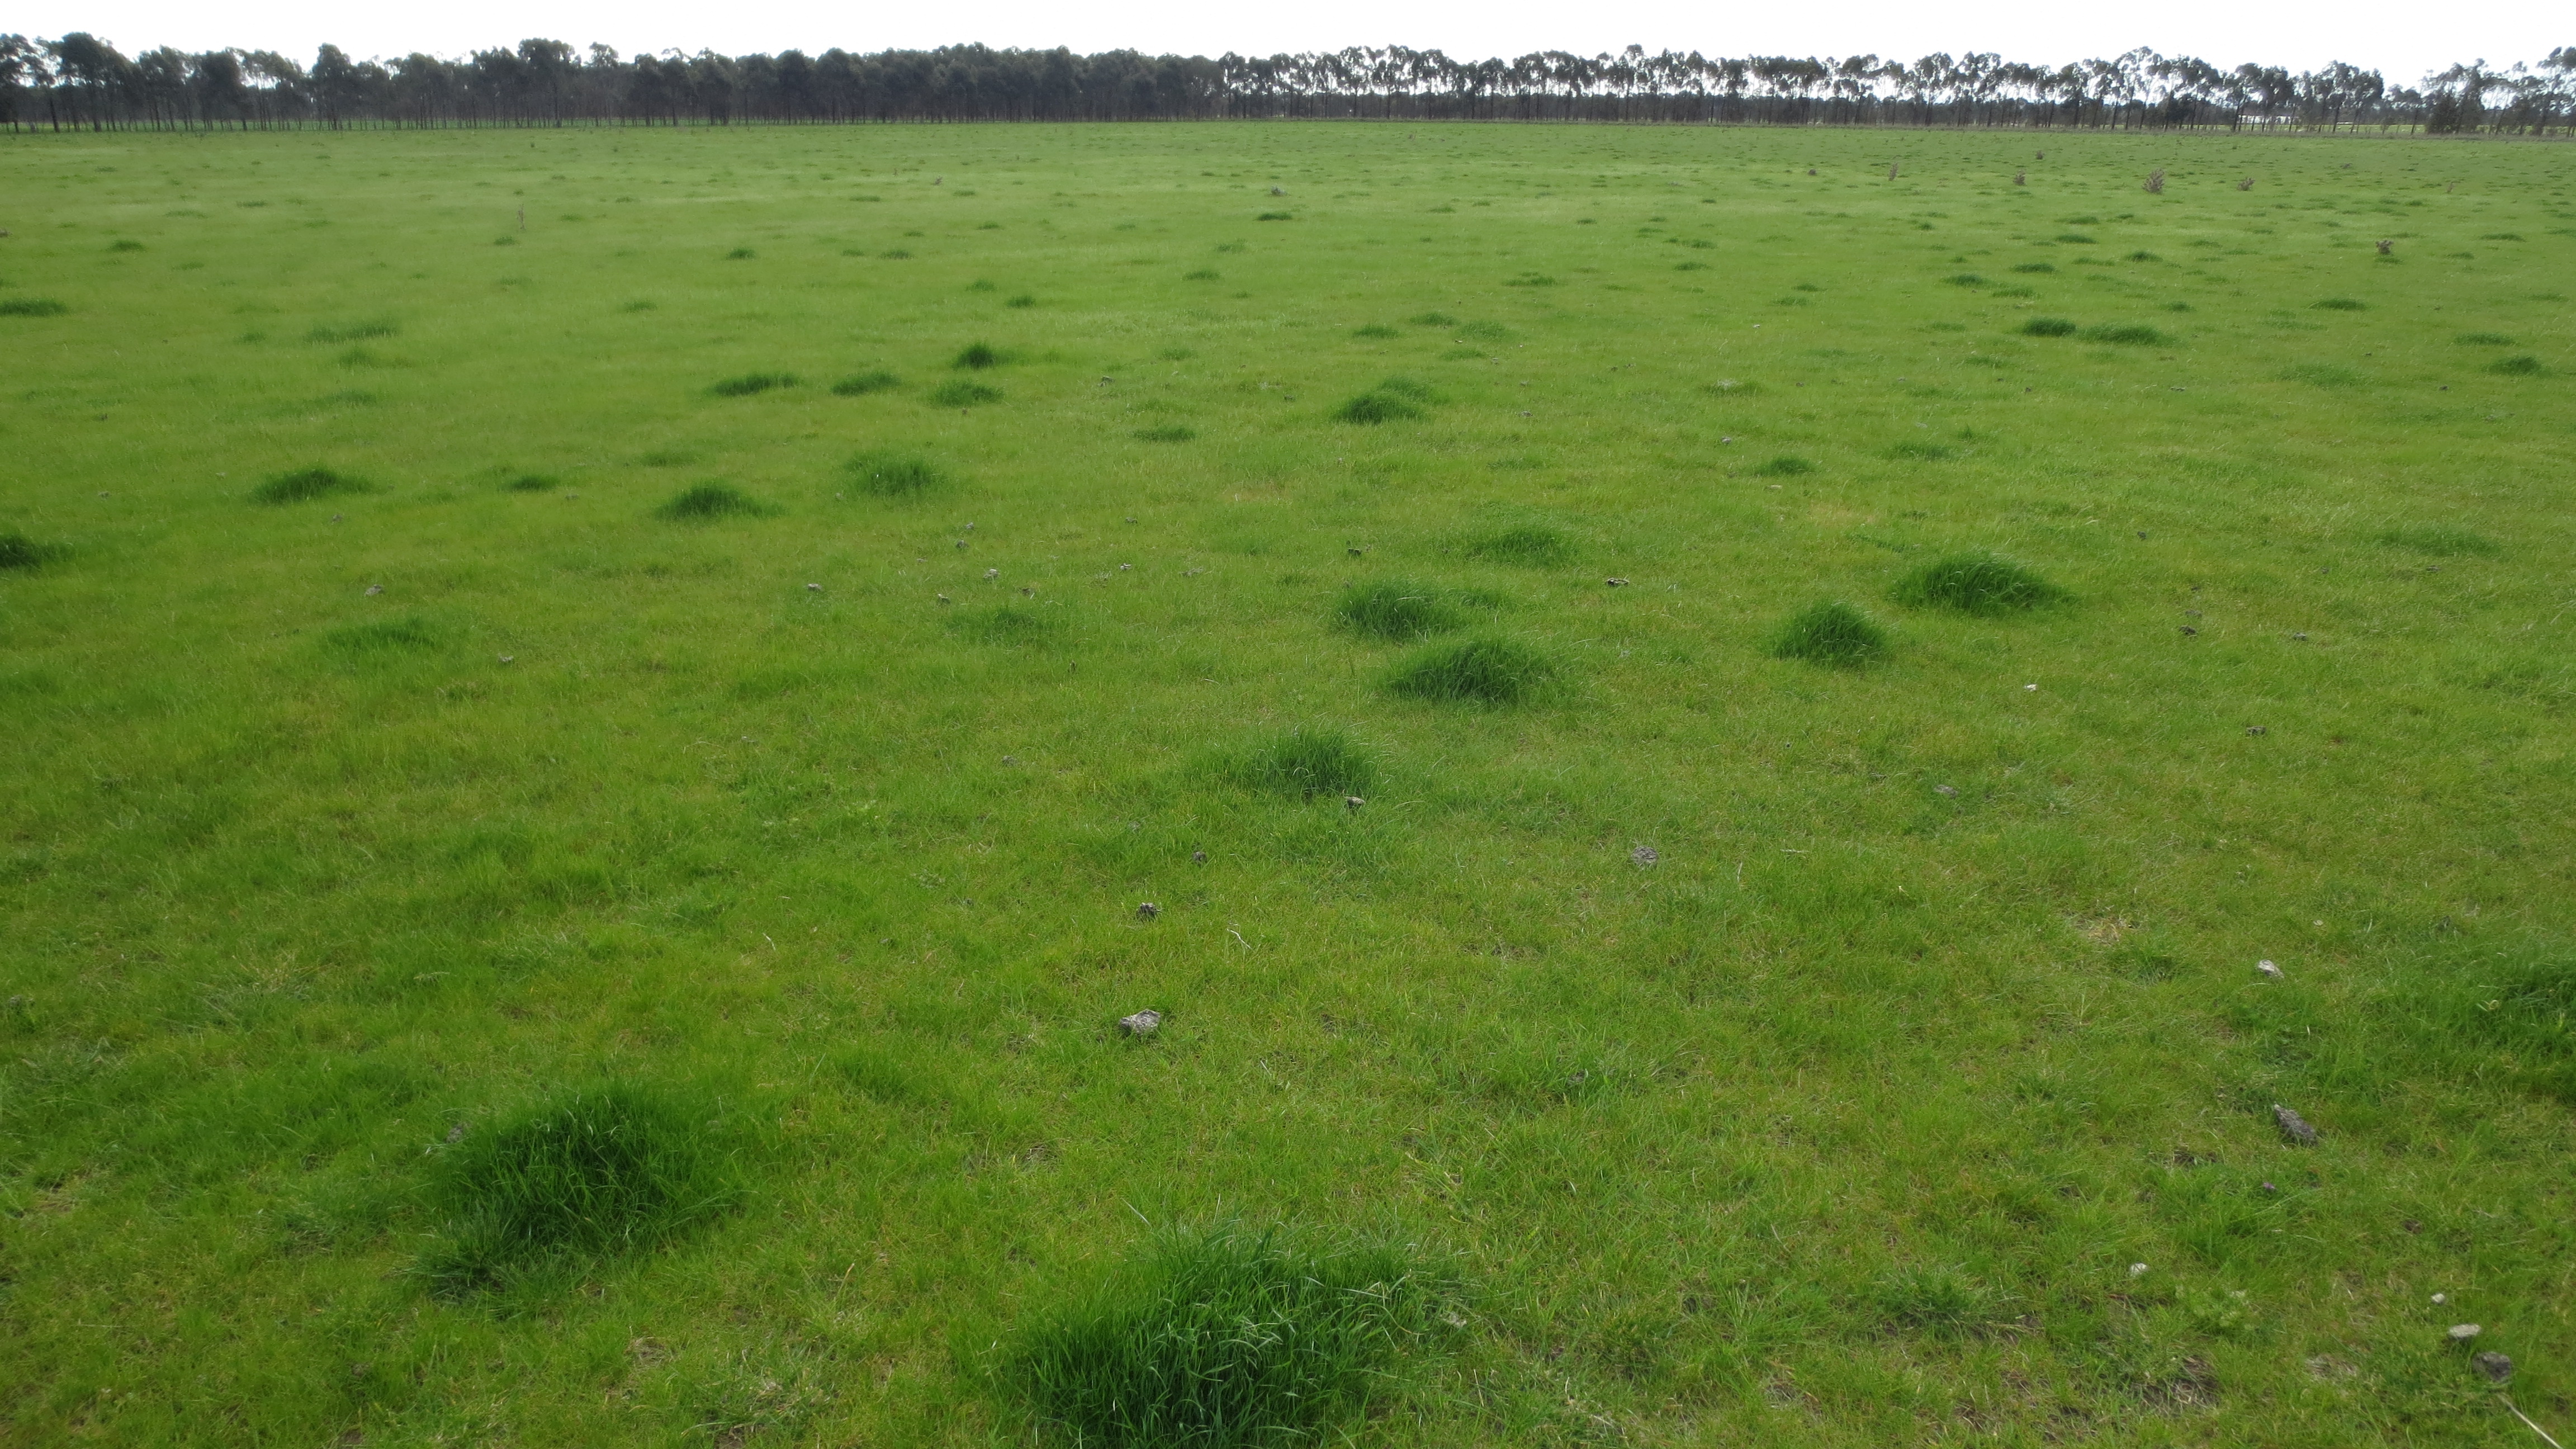
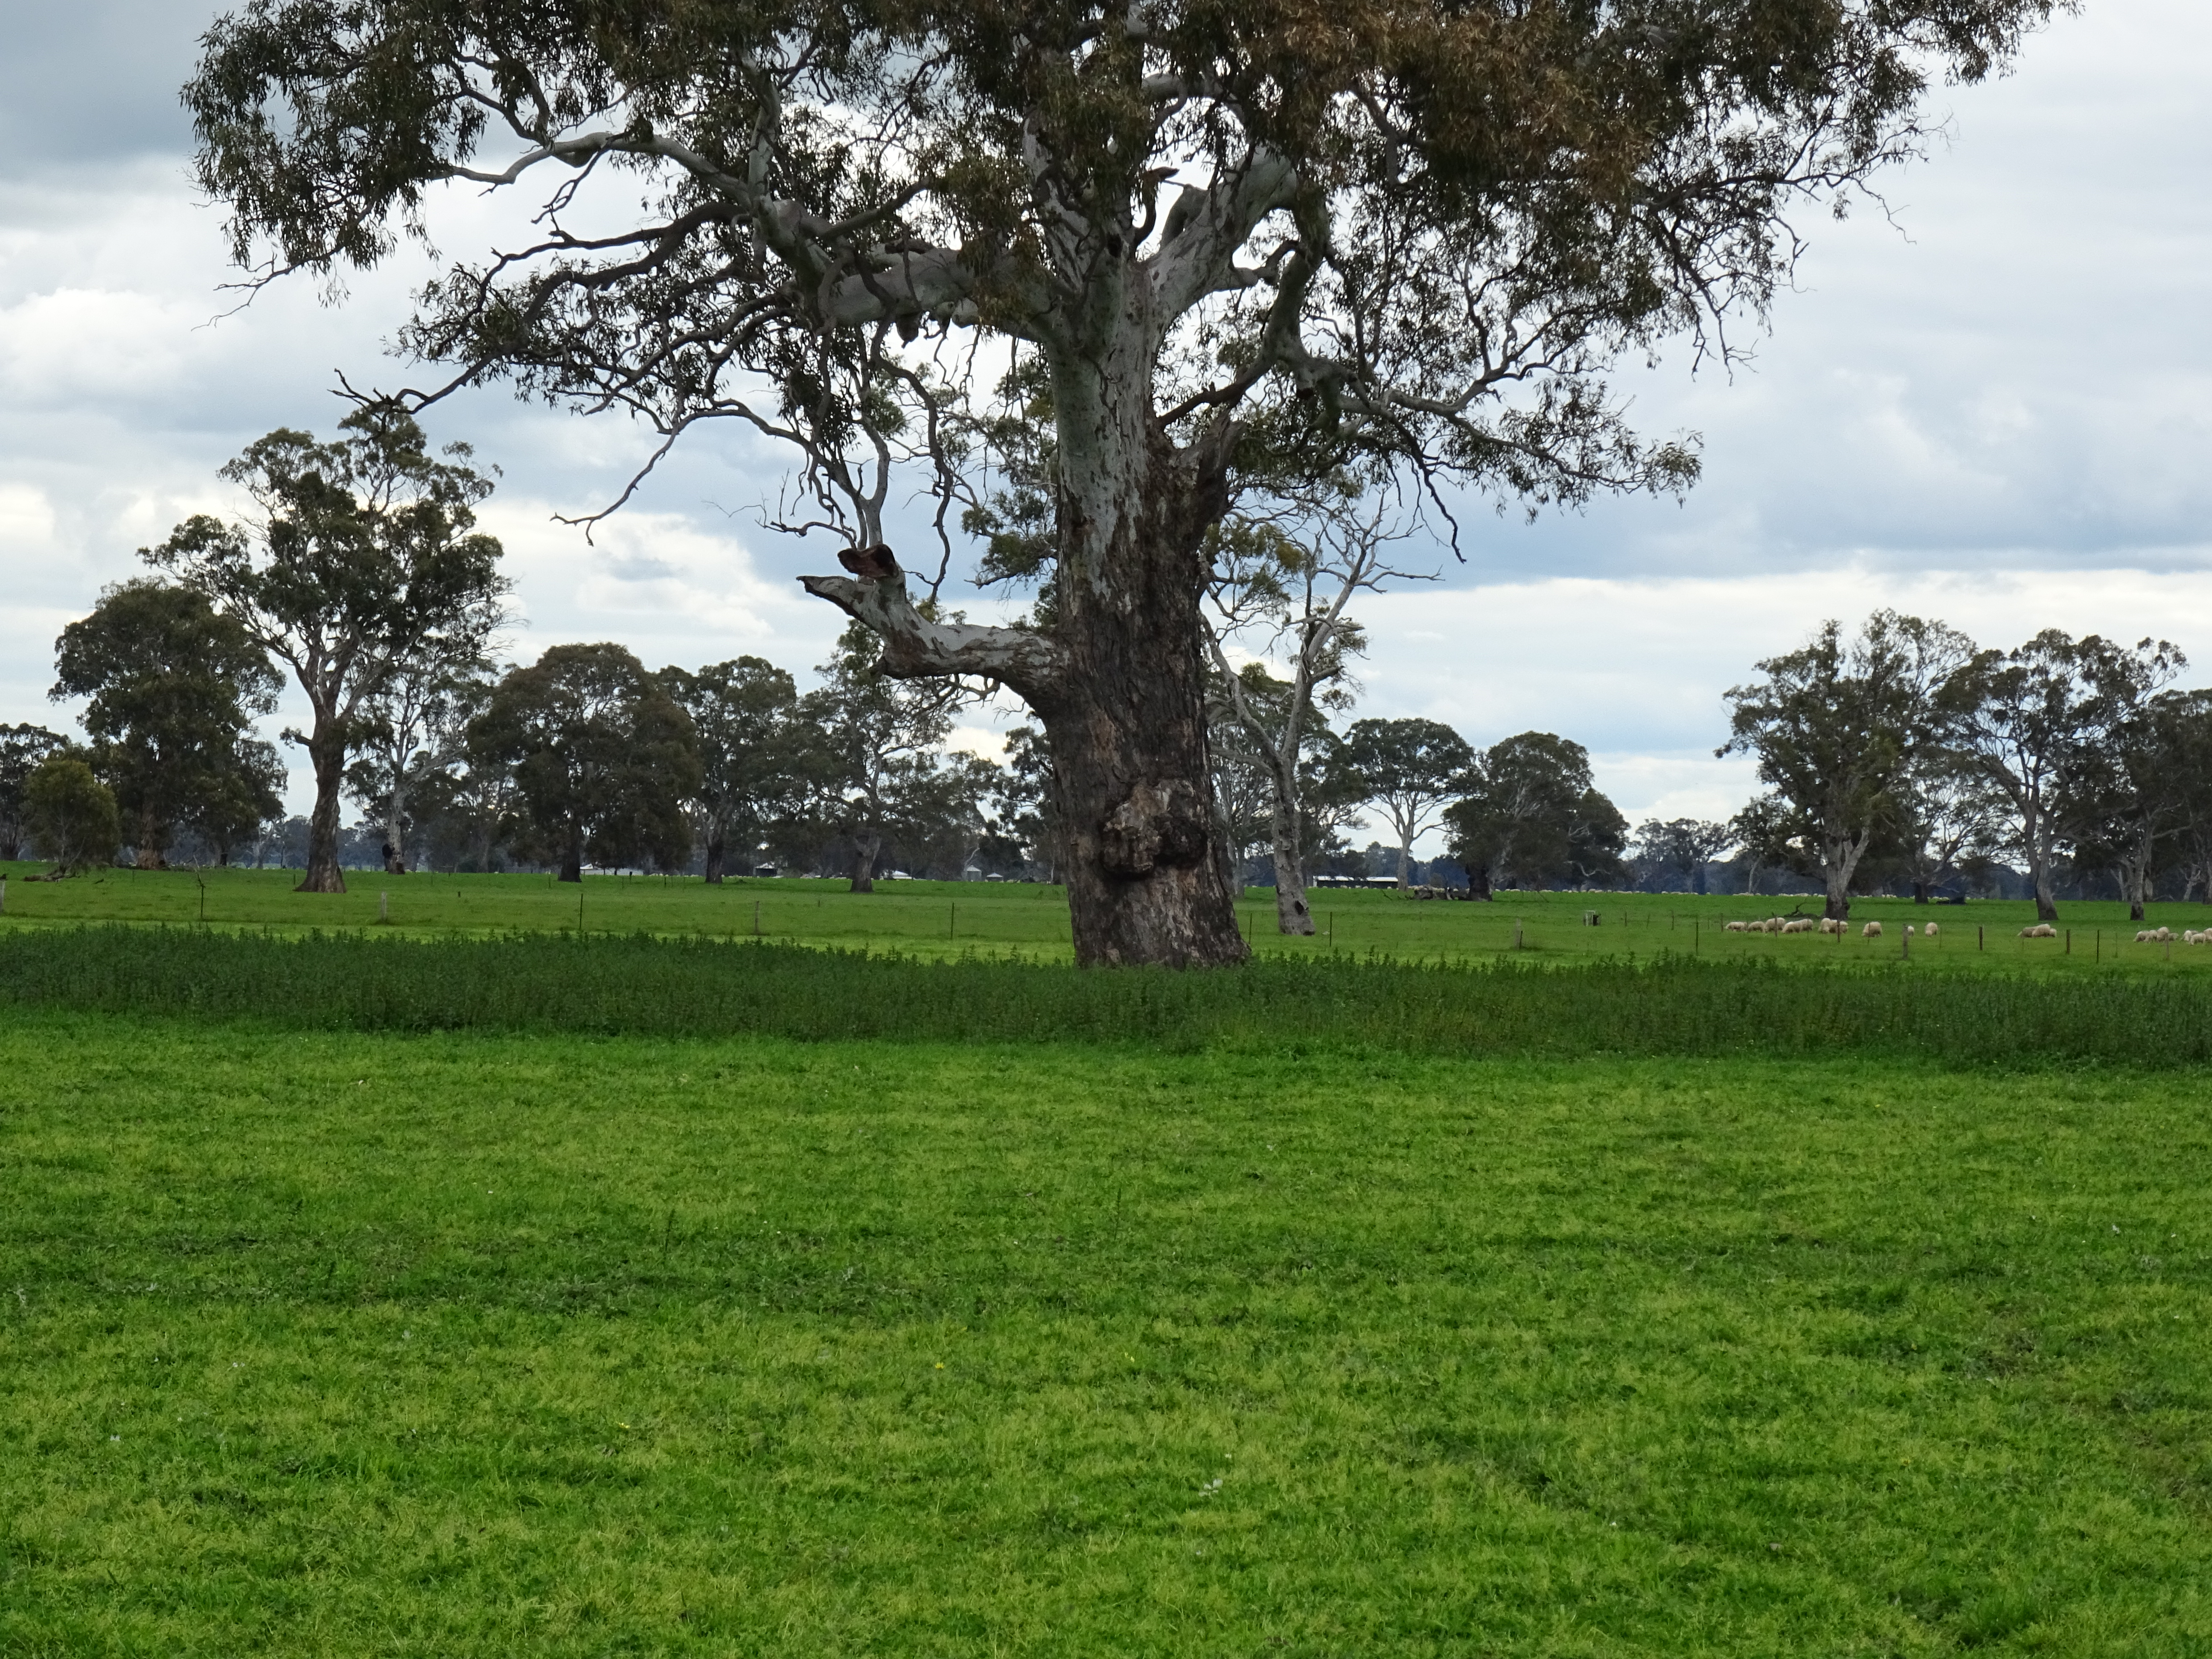
Figure 6.4 Dark green patches responding to urine and dung.
Source: MLA
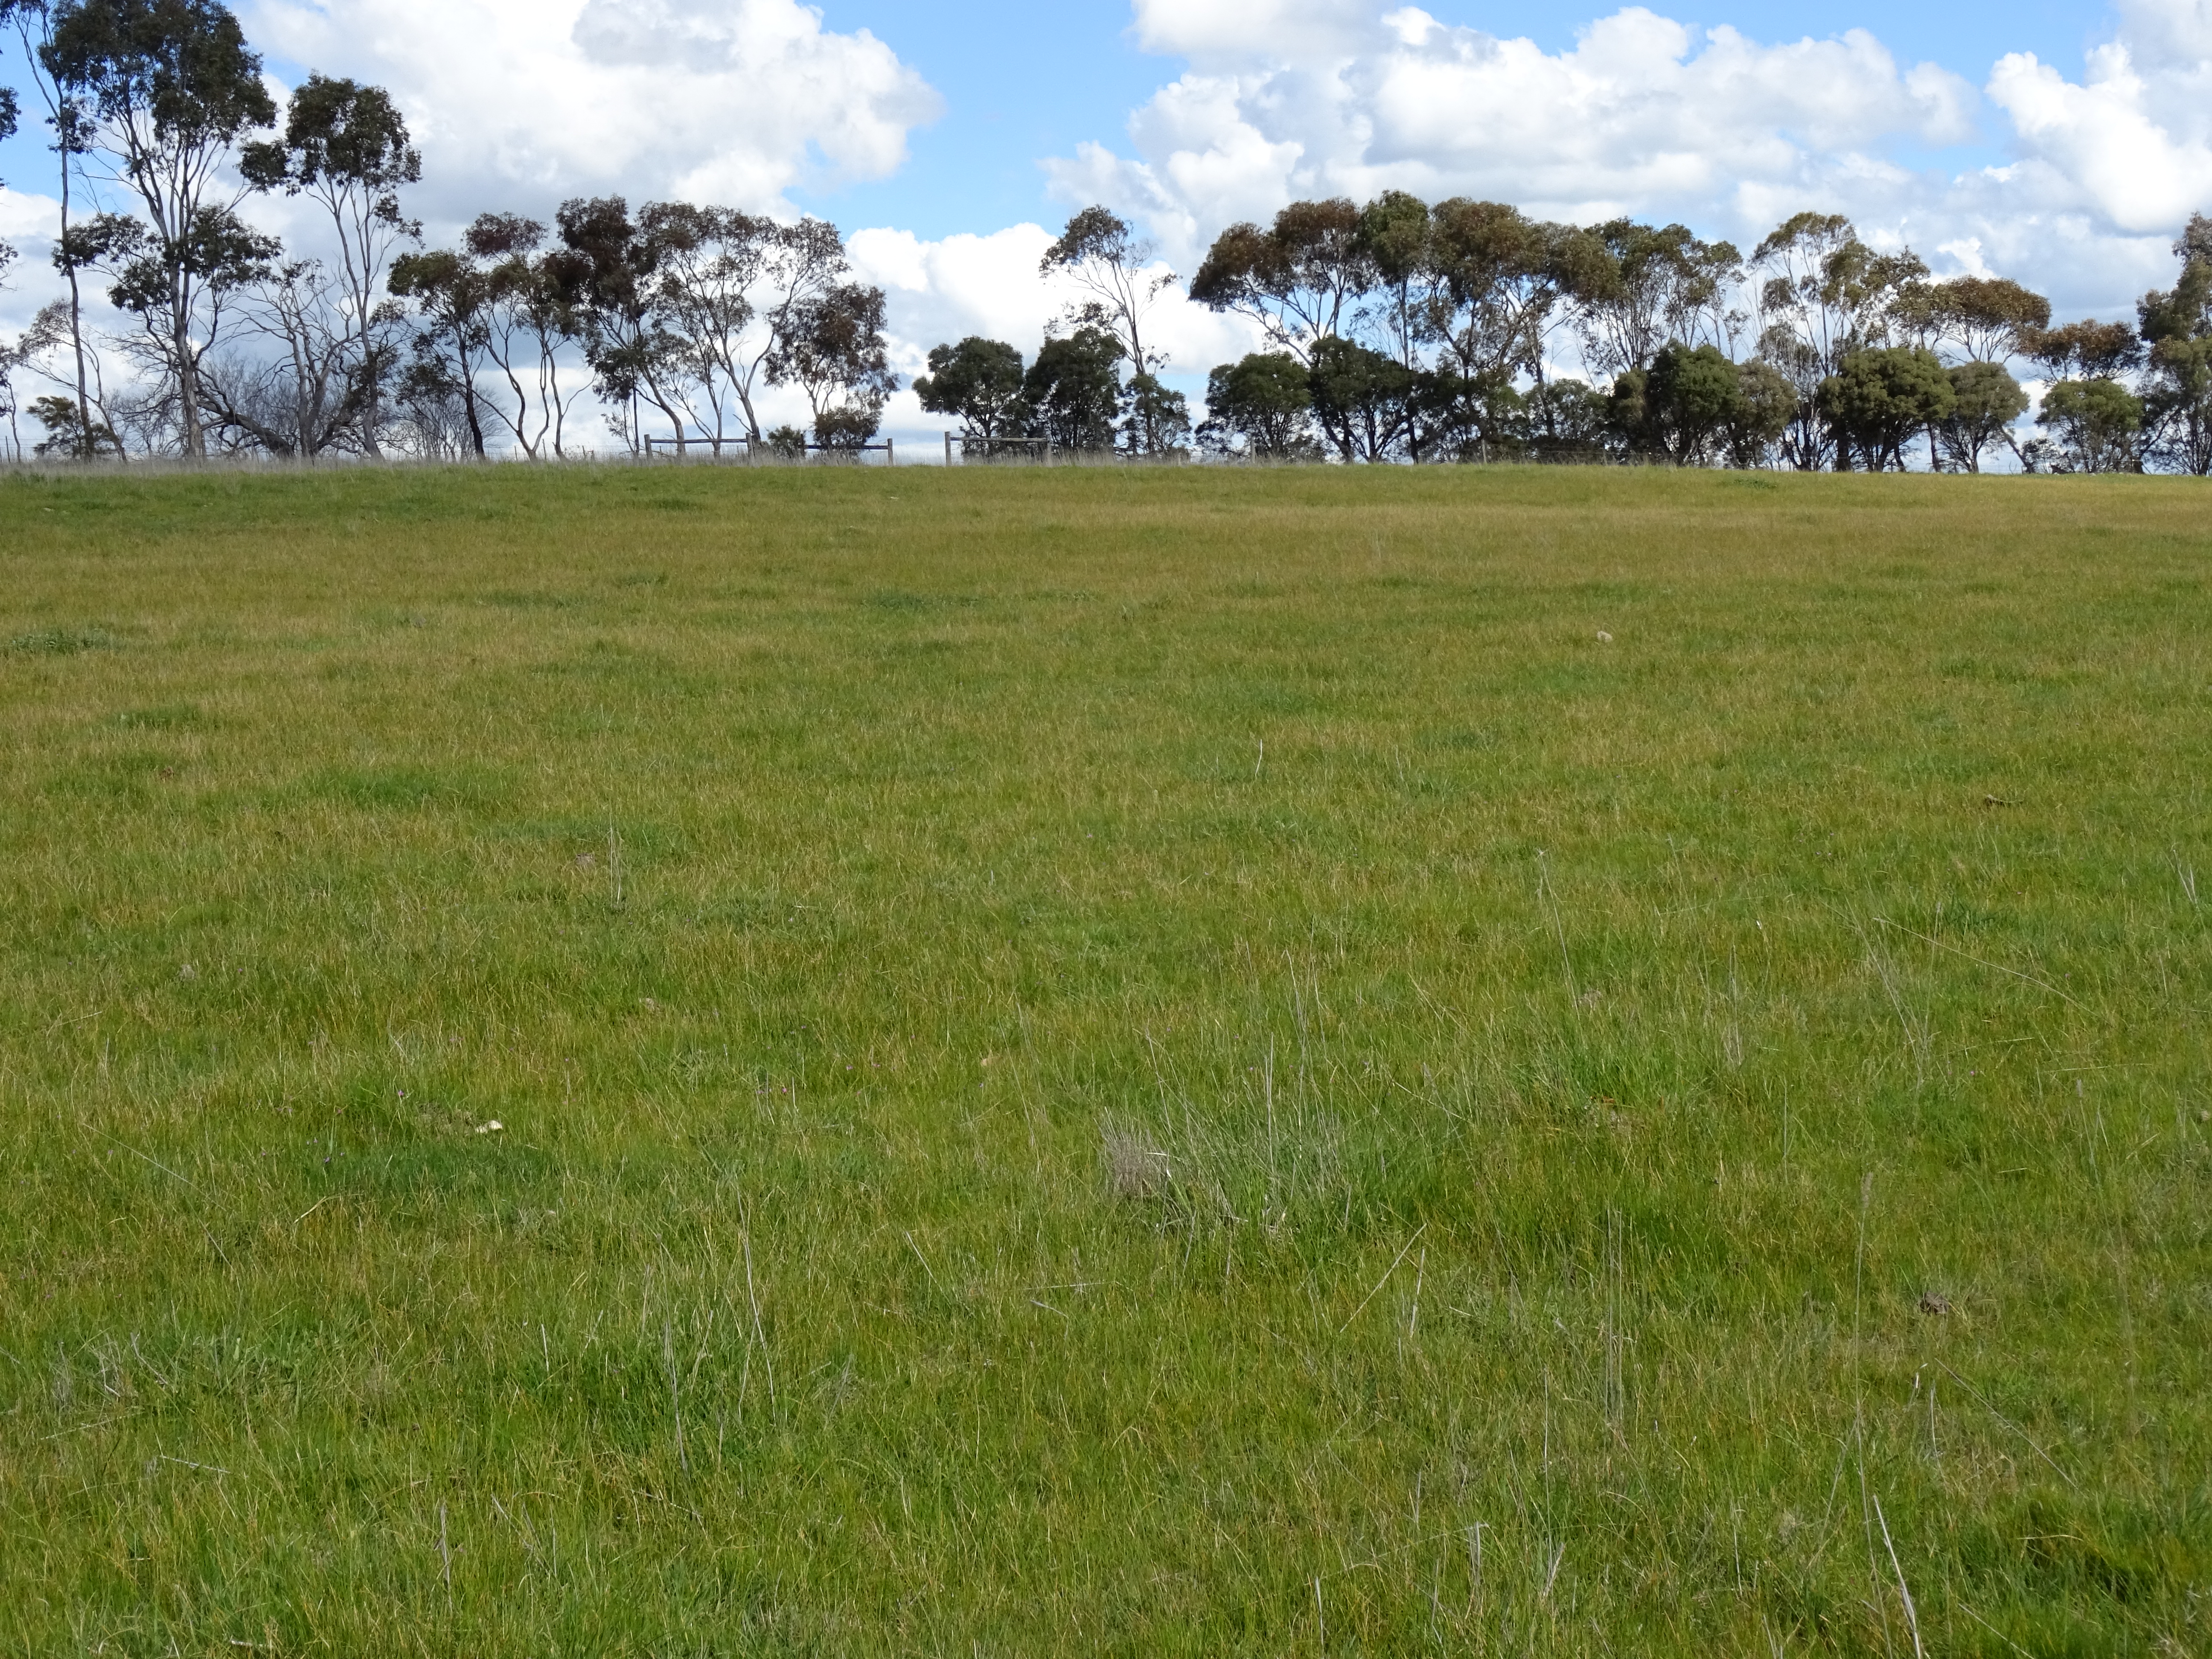
Source: MLA
- capeweed (Arctotheca calendula),
- barley grass (Hordeum leporinum),
- marshmallow (Malva parviflora) and/or thistles within pasture or in stock camps, gateways or adjacent to tree plantations.
- High fertility, particularly nitrogen. Presence of barley grass also indicates high phosphorus levels. It can also indicate overgrazing in late summer which provides ideal conditions for germination.
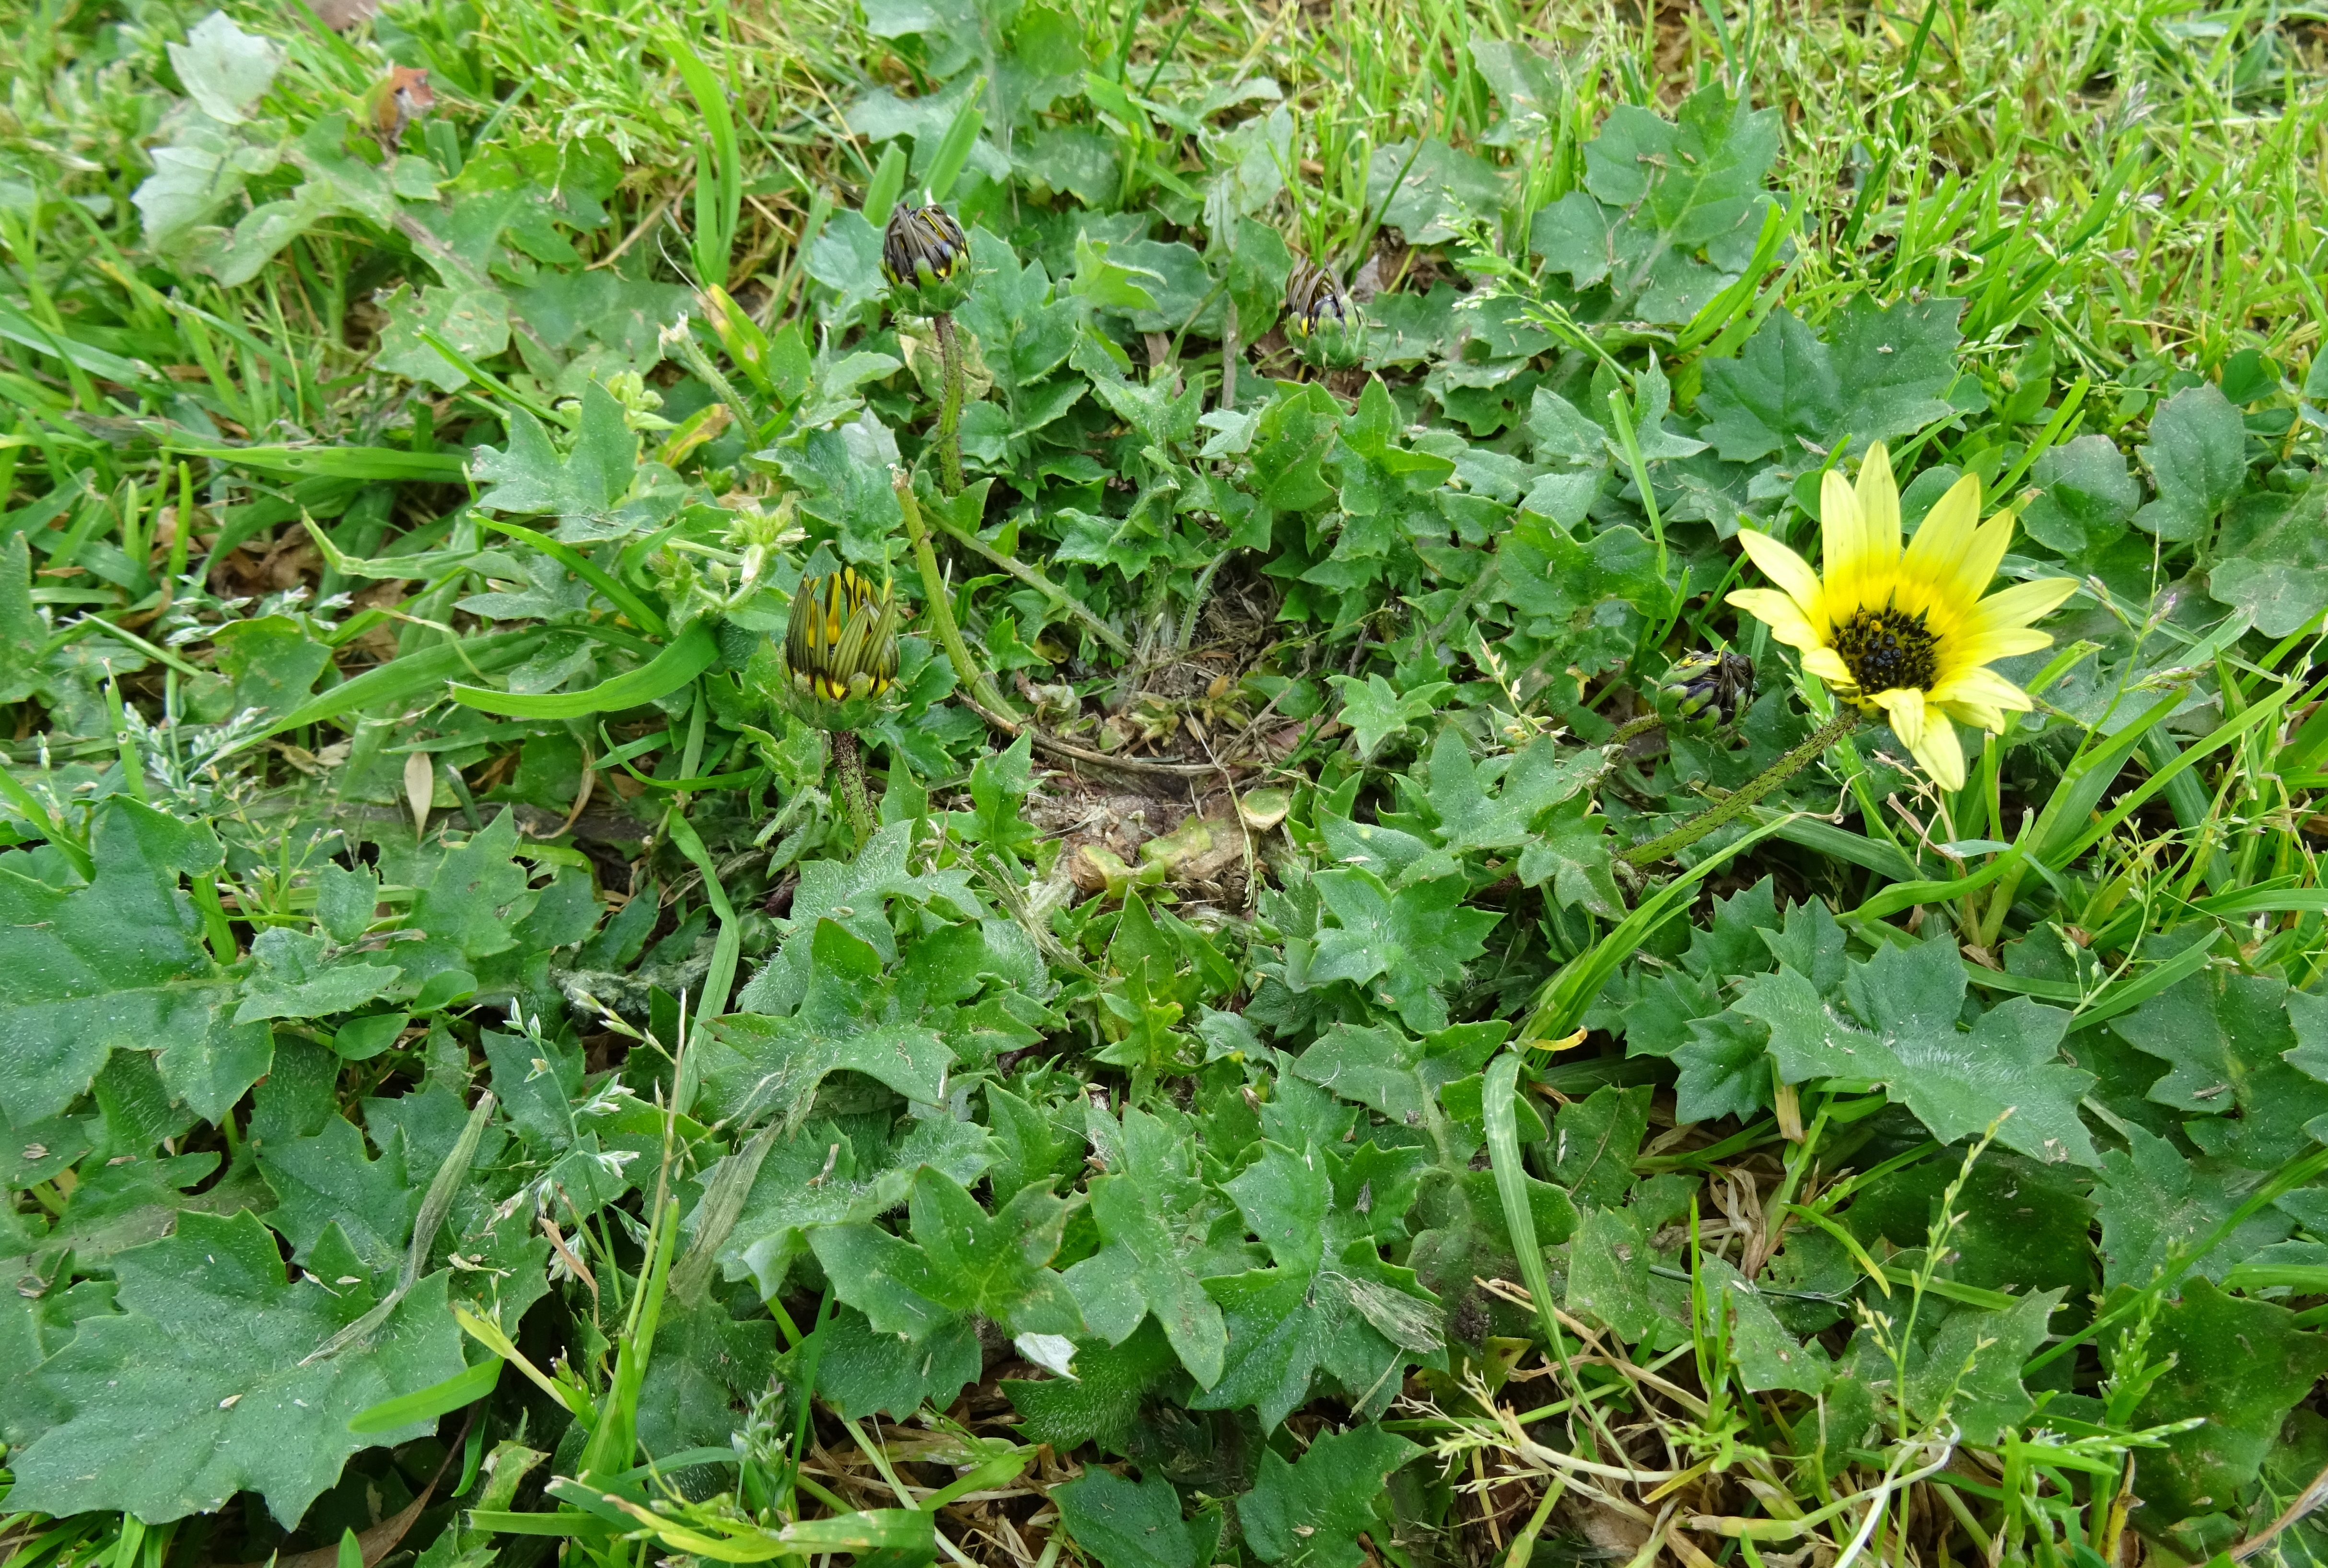
- Flatweed (Hypochaeris radicata) and/or sweet vernal grass (Anthoxanthum odoratum) – low potassium. Common on light textured soils (as potassium leaches) and on paddocks repeatedly cut for hay or silage.
- Bent grass (Agrostis species) and/or fog grass (Holcus lanatus) – low fertility, especially nitrogen but also phosphorus, potassium and sulphur or soil acidity.
- Silver grass (Vulpia bromoides) – low nitrogen or soil acidity.
- Onion Grass (Romulea rosea) – low phosphorus.
Predicta B
PREDICTA® B is a rapid diagnostic test to identify soil borne diseases (such as Pythium, Phytophthora, Aphanomyces and Rhizoctonia) which cause root rot and damping off, particularly in legumes.
Testing has traditionally occurred in the cropping phase as the testing procedures are more advanced in cereals. However, it is now possible to test pastures to detect high, medium and low population densities of these major soil-borne diseases.
PREDICTA® B testing is conducted by South Australian Research and Development Institute (SARDI). Contact SARDI to discuss test options and locate accredited agronomists who can take samples.
SIGNPOSTS
WATCH
A quick guide to in-paddock tests you can do to better understand the visual indicators of soil health.
Ten simple tests to monitor and assess your soil's health. A field tool for farmers, by farmers, to assess the biological and physical properties of soil.
Soil testing of pastures is crucial for assessing and improving nutrient and structural status. This video demonstrates how to plan and carry out soil sampling to make sure you get a reliable and useful result.
Managing soil fertility and conditions are essential for good pasture and crop growth. Testing soils regularly can help identify if there are components of the soil limiting production and can also identify soils that don’t require inputs.
Healthy soils are fundamental for healthy farming systems. This video is the first of three in a series that shows common paddock indicators of soil condition, designed so that you may start to recognise and diagnose underlying soil problems.
This video is the second of three in a series that looks at the common indicators of soil condition in plants and the pasture.
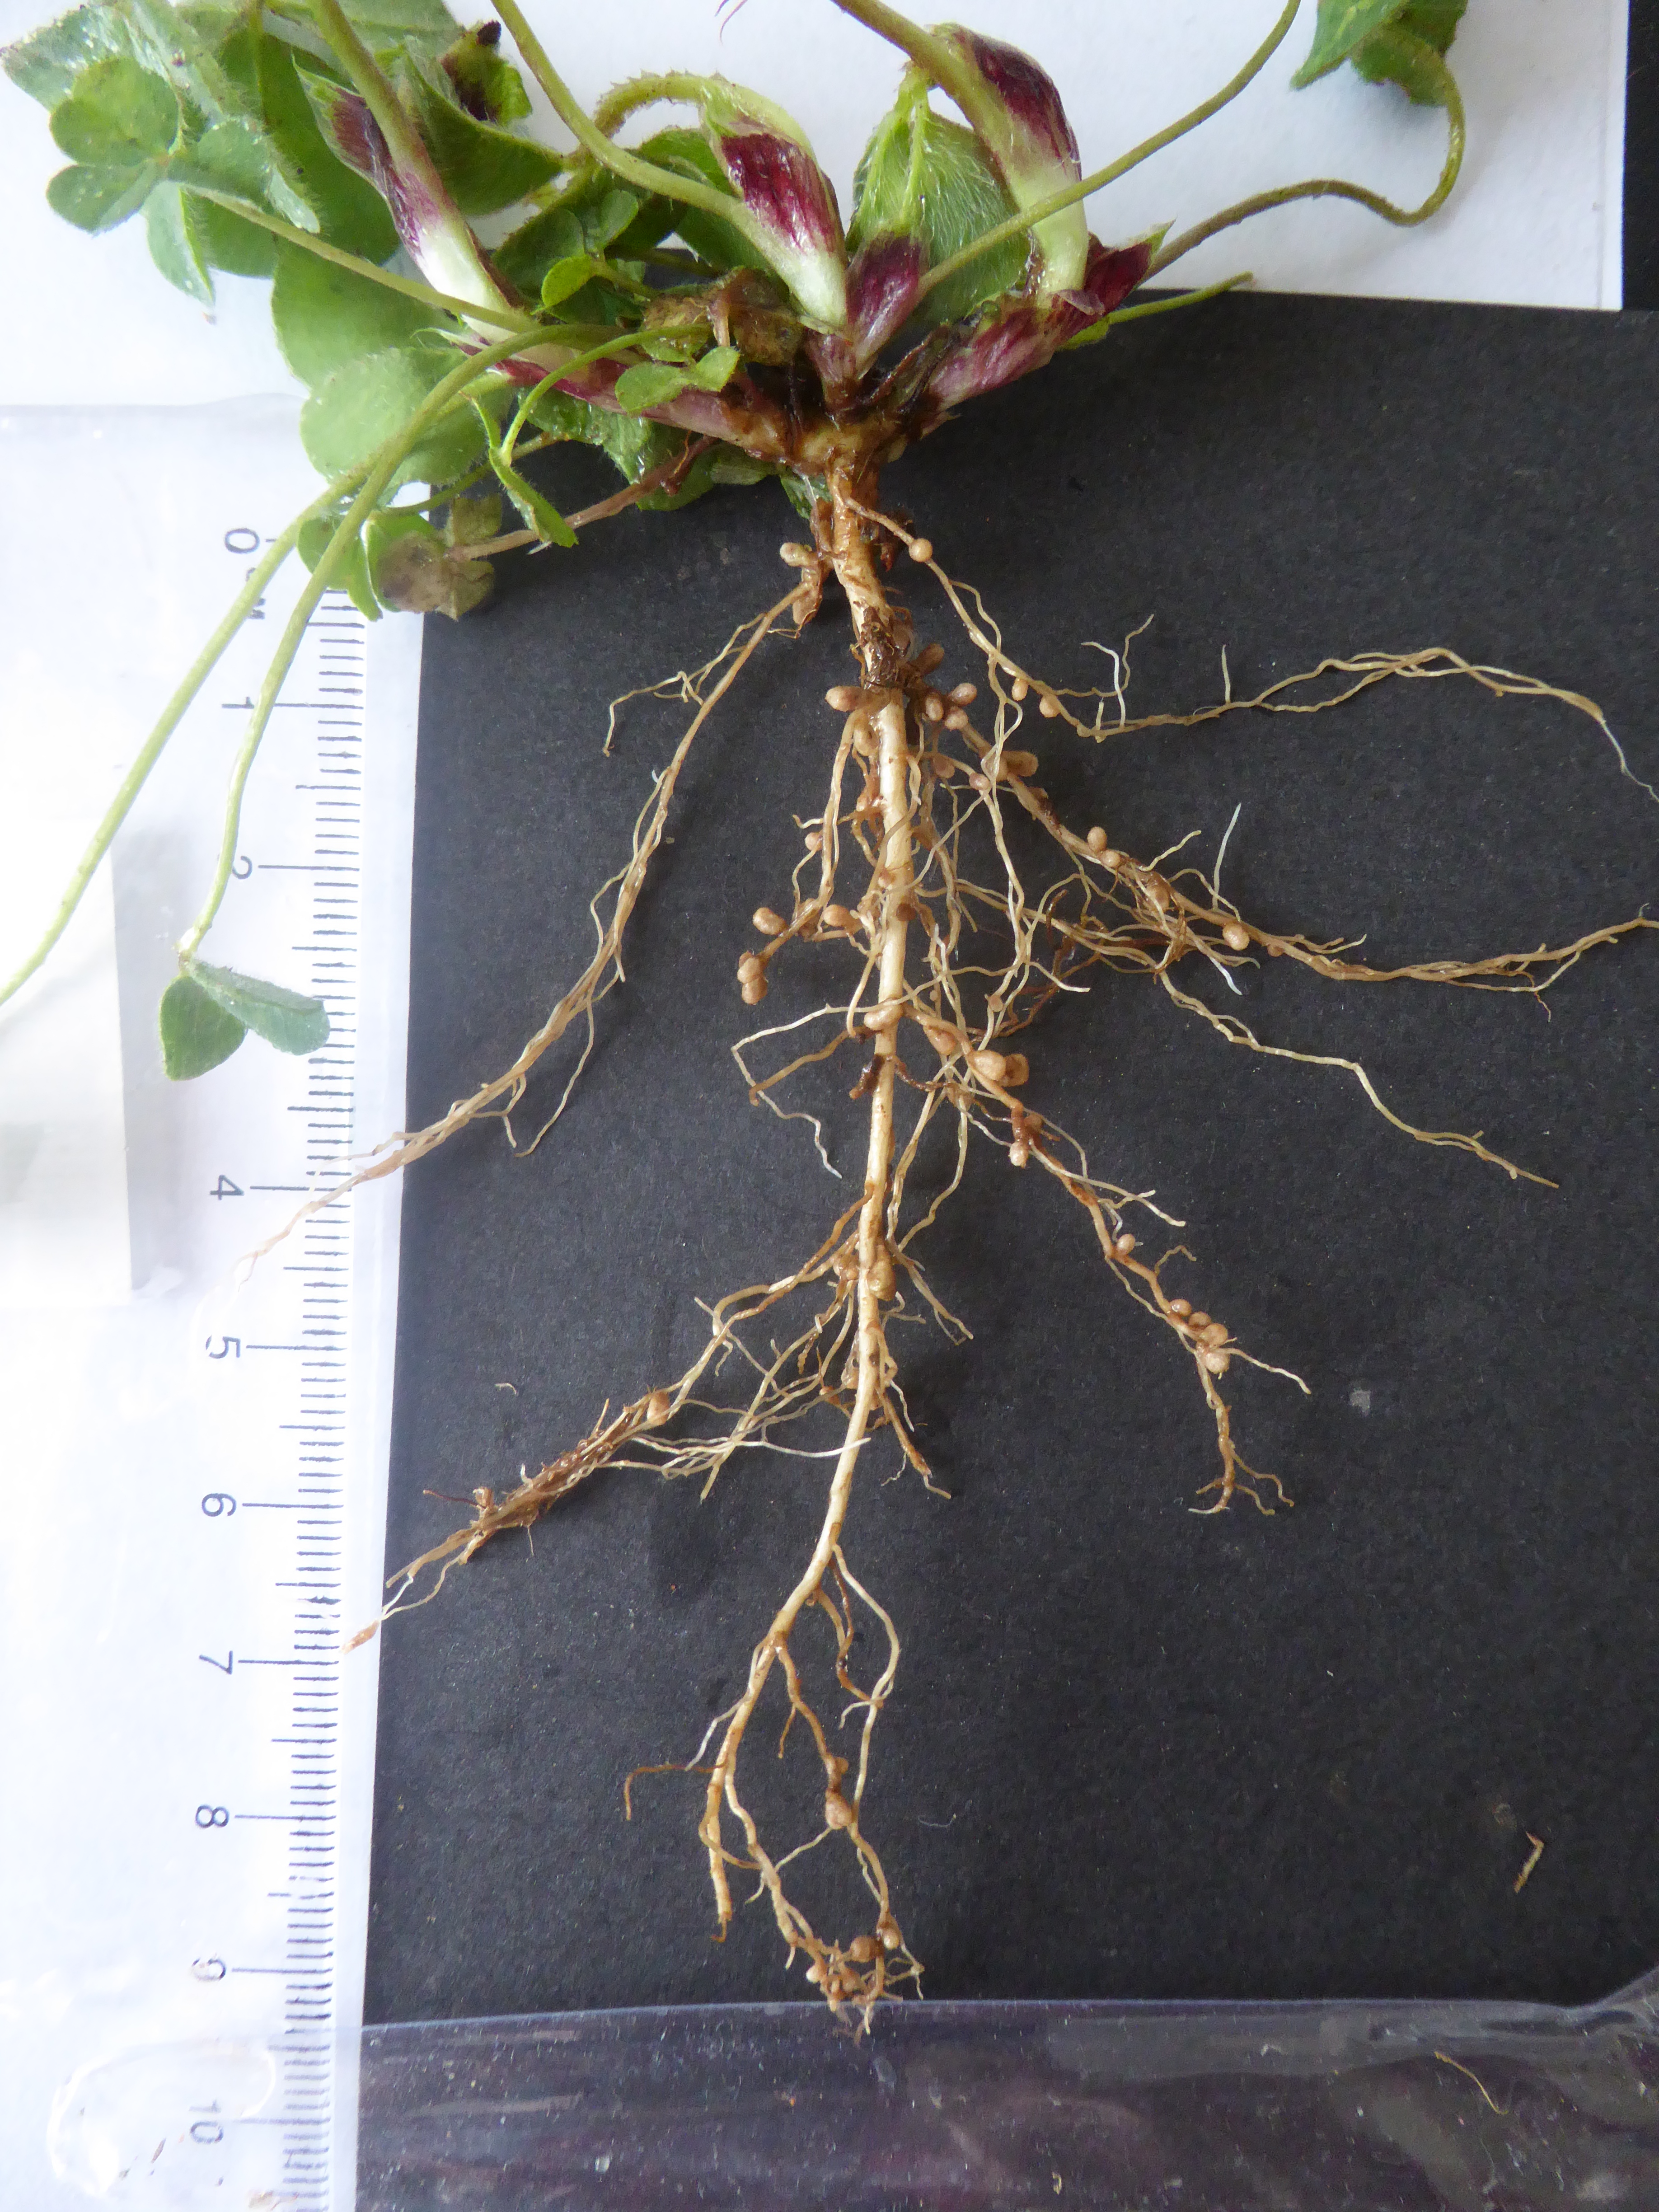
This video is the last of three in a series that looks at common indicators of soil condition that you see on the soil surface or on the roots of legumes.
READ
Healthy, fertile soils drive pasture productivity and deliver environmental benefits through improved water and nutrient use with less risk of surface run-off, erosion and deep drainage.
A practical guide to soil tests, what soil tests are, when they can be used reliably and consistently, and discusses what limits their application.
A practical manual explaining the basics of soil-plant relationships and the principles of fertiliser use, looking at types of soil, how they are classified and the interaction of soil, water and nutrients. It also provides an insight into how plants utilise nutrients and the role individual nutrients play in the process of plant growth.
Soil sampling and testing is an essential part of making good fertiliser decisions. Fertilisers are a large cost to farming pastures in high rainfall areas.
Soil fertility depends on three major interacting components: biological, chemical and physical fertility. Soil organisms improve soil fertility by performing a number of functions that are beneficial for plants.
Soil type, condition and fertility have a large impact on persistence, production, composition and nutritive value and hence animal production and economic return from pastures.
Answers to frequently asked questions from growers and advisors about soil organic matter, soil biology and their relationship to other topics such as nutrient cycling, stubble management and water repellence.
One of the biggest influences on farm productivity and its resilience to climate variation is soil health. Soil organic matter contributes to a range of biological, chemical and physical properties of soil and is essential for soil health.
A rapid diagnostic test used to identify soil borne diseases such as Pythium, Phytophthora, Aphanomyces and Rhizoctonia which cause root rot and damping off.
USE
Indicators in plants and pasture such as patchy growth, discolouration, sward composition and weed burden can be used to recognise and diagnose underlying soil problems.
Phosphorus is applied to Australian pastures because most soils have low P-availability for plant growth and this constrains pasture growth. This tool is intended to assist P fertiliser decisions for temperate, legume-based pastures in acid soils in southern Australia.
ATTEND
A coaching and training package developed to help producers get the most bang for their fertiliser buck. Skills learnt include interpreting a soil test, calculating rate and fertiliser type, prioritisation of paddocks and return on investment using decision guides.
Skills to identify possible soil constraints within southern Australian pasture systems.
Tips and tricks to utilise soil testing as a management tool that gives a measure of soil fertility and conditions.